Download
1 / 22
220 likes | 243 Views
This study explores the analysis of terrain evolution using Lidar data and open-source GIS techniques. It covers topics such as point density analysis, noise and accuracy analysis, spatial approximation and analysis, map algebra, contouring, flow routing, and change analysis. The workflow for terrain modeling and change analysis in GRASS6, an open-source GIS, is also discussed.

E N D
GRASS GIS Analysis of Terrain Evolution using Lidar data and open source GIS H. Mitasova, M.Overton, J.J. Recalde North Carolina State University Raleigh, USA R.S. Harmon Army Research Lab., Army Research Office Research Triangle Park, Durham, USA
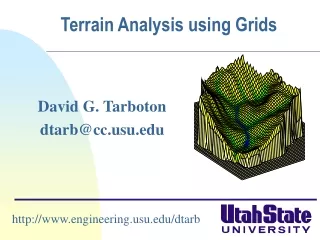
Multitemporal set of LIDAR Points Density, noise and accuracy analysis using binning: • selection of resolution and approximation method, • systematic error removal Spatial approximation and analysis using RST: • smoothing of random noise, • computation of elevation surface and its parameters Multitemporal DEM, slope, aspect, curvatures rasters Map algebra, contouring, flowrouting: • natural feature extraction Multitemporalridge, crest, shoreline, stream maps Map algebra, spatial query: • quantification of change Change maps, tables, graphs Workflow for Terrain Modeling and Change Analysis
GRASS6: open source GIShttp://grass.itc.it • 1984 started at CERL as land management system • 1999 GPL, all common OS, 32/64bit, code in C • Web-based infrastructure for managing the code • fully integrated 350+ modules • add-ons managed on wiki • raster:map algebra, DEM analysis, flow, buffers, solar, • image: rectification, multispectral,reclassification • vector:buffers, overlays, networks, • DBMS:attribute management, SQL • transformations: projections, raster-vector, interpolation • visualization: 2D, 3D visualization, ps maps • WMSsupport, Google earth through v.out.ogr
North Carolina Lidar Surveys 2005:USACE Topo/Bathy Mapping after hurricane Ophelia SHOALS-1000T hydrographic (1pt/5m) and topographic lidar 2004: USACE Topo/Bathy Mapping SHOALS-1000T 2003,June, Sept. 18, 21: NASA/USGS EAARL, acquired just before and after the hurricane Isabel landfall 2001: NC Floodplain Mapping survey, Leica Geoscan 1996-2000: USGS/NASA/NOAA ATM II published vertical accuracy is between 15cm - 30cm
ft 158 Nags Head Woods Jockey's Ridge Outer Banks Nags Head Evolving coastal landscape: Jockey's Ridge sand dunes 2001 DEM (20ft resolution) based on NC Floodplain lidar survey
Jockey’s Ridge 1999 sand pavement vegetation ocean 0 500m Photogr. 1974, 95, 98 Lidar 1999 Lidar 2001 RTK-GPS 2004 N
Define site specific terrain change measures - vertical change: peaks, spatial pattern of el. change - horizontal migration: dune crests and peaks, lateral movement of ridges how fast it moves, is there acceleration? - area change: is the dune area shrinking – overcome by vegetation? - volume change: is dune gaining or losing sand? Methods for extraction of dune features: differential geometry and map algebra Measure and compute change: standard GIS tools Terrain Change Analysis
Tuning the level of detail for feature extraction RST tension and smoothing is used to create surface at a desired level of detail while keeping the 1m res. tension 700 tension 100 profile curvature slope road
Dune Migration a N b sand lost a b sand gained c stable d c e d 0 500m e South and East dunes: 6m/y Main West: 3m/y 1974: 108 ft. 2001: 72 ft. rate of horizontal migration The main dune rotates clockwise while its peak moves southeast. Volume and area are relatively stable
Changes in elevation and shape 1949: 138 ft 1974: 110 ft 2001: 83 ft View from the ocean (east) 2001 1974
Dune field evolution: 1974-2001 N Relocation of leading south dune that was moving out of park boundaries more surveys are needed to understand whether the management is working
Working with lidar data from a diverse set of surveys Oregon inlet avg. no. of points per 2m res. grid cell 1996 0.2 ATM 1997 0.9 ATMII 1998 0.4 ATMII 1999 1.4 ATMII 2001 0.2NCflood 2003 2.0 EAARL 2004 15.0 SHOALS 2005 6.0 SHOALS Major overwash area used for testing 0.3m res. 2004 DEM
Increasing LIDAR point density 1998 2004 substantially improved representation of structures but much larger data sets 1m resolution DEM computed by RST binned computed by RST 2004 lidar 0.5m resolution DEM
Mapping LIDAR point density pt / 2m grid cell 2001: NC Flood 2004: SHOALS Point density maps created by binning draped over 2m res DEM (2001) are used to select common resolution
Shifts in Lidar Surveys Boxplot elevation differences between the most accurate 2004 DEM and other surveys computed along 1m wide road centerline strip: most surveys are shifted 10-20cm above or below road elevation difference [m] 1996 1997 1998 1999a 1999b 1999c 2001 2003a 2003b 2005
Impact of shifts in Lidar data Do we have high erosion rate? Is the road sinking? original: blue: 1999 black: 2001 Aerosion 12m B accretion 2m corrected: red: 1999 violet: 2001 Aerosion 4m (!) B accretion 8m A elevation difference [m] B 1996 1997 1998 1999a 99b 99c 2001 2003a 03b 2005
Analysis of systematic error Elevation difference between RTK-GPS survey (0.03m RMSE) and lidar data along centerline of a stable road. RTK-GPS 2001 lidar mean diff = -0.23m elevation [m] 0 0.7 1.3 2.0 2.6 3.2 distance [km] RTK-GPS 2004 lidar mean diff = -0.06m Elevation difference between 2001 and 2004
Conclusions - analysis of points density and systematic error is essential when using lidar for assessment of topographic change from multiple sources • automated tracking of extracted features is needed for more efficient measurement of change - open source geospatial software provides powerful, customizable tools for analysis of terrain change • OSGEO foundation supports the development of open source geospatial software and promotes its use. First Joint Meeting 9/2006, Lausanne, CH=> FOSS4G2006 Conference http://www.foss4g2006.org
Acknowledgment Funding by US Army Research Office, NC WRRI and North Carolina Sediment Control Commission is gratefully acknowledged We also thank Geodynamics for performing the accurate road survey.
(General) statistical computing environment:http://www.r-project.org/ Rgeo: spatial data analysis in R, unified classes and interfaces (e.g, RGRASS)http://r-spatial.sourceforge.net/ PostgreSQL Most advanced open sourcerelational database http://www.postgresql.org/ PostGIS: support forgeographic objects to the PostgreSQL object-relationaldatabase http://postgis.refractions.net QGIS: user friendly Open Source GIS http://www.qgis.org Spatially-enabled Internet applications http://mapserver.gis.umn.edu/ Communities growing together GRASS GISSpatial Computing http://grass.itc.it GDAL - Geospatial Data Abstraction Library http://www.gdal.org ... AND MANY OTHERS! http://www.osgeo.org
Accuracy of approximated DEMs RMSE of interpolated DEMs, based on 50pts measured on pavements using RTK-GPS: 0.25m (1995) and 0.03m (lidar 1999, 2001) Lidar 1999, first return data: spatial distribution of deviations Surface deviation from the given points as function of tension vegetation spatial distribution of vegetation all sand