Download
1 / 29
310 likes | 478 Views
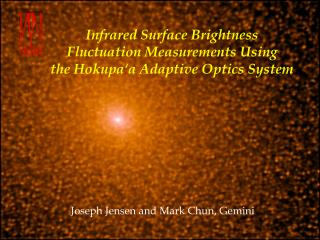
Infrared Surface Brightness Fluctuation Measurements Using the Hokupa‘a Adaptive Optics System. Joseph Jensen and Mark Chun, Gemini. Overview. IR surface brightness fluctuations (SBFs) are useful as a distance indicator to galaxies beyond 100 Mpc thanks to high-resolution imaging.

E N D
Infrared Surface Brightness Fluctuation Measurements Usingthe Hokupa‘a Adaptive Optics System Joseph Jensen and Mark Chun, Gemini
Overview • IR surface brightness fluctuations (SBFs) are useful as a distance indicator to galaxies beyond 100 Mpc thanks to high-resolution imaging. • Hokupa‘a on Gemini can routinely produce image quality better than 0.1” FWHM using guide stars around 14th mag. At 100 Mpc, a 10% distance measurement can be made in about 15 min on-source.
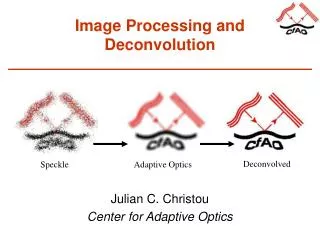
SBFs and Adaptive Optics • Surface brightness fluctuations can be used as a unique tool for measuring PSF variation • Surface brightness fluctuations are convolved with the point-spread function • You don’t need to resolve individual point sources • SBFs in nearby galaxies fill the field so the PSF can be measured anywhere the S/N is high enough
Surface Brightness Fluctuationsas a Distance Indicator • Relies on the Poisson statistics of stellar populations • The “standard candles” are red giant stars—relatively well-understood creatures • Well calibrated empirically (using Cepheids) • Accurate to better than 10% • Fluctuation magnitudes compare well to predictions of stellar population models
= 64 = 8 / = 12.5% = 16 = 4 / = 25%
Distant galaxies appear smooth compared to nearby ones. 5” M 32 (0.77 Mpc) NGC 7768 (100 Mpc)
Why IR SBFs? • Much less sensitive to extinction by dust • 30 times brighter at K than at I (Red giants, the brightest stars in old populations, really are red! ) • Seeing is much better in the near-IR (especially with AO) • Integration time scales linearly with seeing • Greater contrast of fluctuations with respect to globular clusters and background galaxies • You can go much further using IR SBFs!
Potential Applications • Determine the Hubble constant far enough out that peculiar velocities are negligible • Establish the linearity of the Hubble flow out to 200 Mpc • Explore the mass distribution in the local universe by mapping the peculiar velocity field • Probe stellar populations in galaxies without resolving individual stars
The basic procedure: • Get good, deep images of an elliptical galaxy Use integer pixel registration to avoid correlations in the pixel-to-pixel noise • Subtract a smooth fit to the galaxy • Fourier-transform and compute the spatial power spectrum • Measure the power spectrum of the PSF • Fit the data spectrum to the sum of the scaled PSF power spectrum and a constant white noise component P0PSF(k) + P1
H-band SBF Measurements • To achieve minimal signal-to-noise at H, the integration time using Hokupaa on Gemini is: • At Virgo, 30 sec will do • For PSF measurements across the whole field of view, increase the exposure times by a factor of a few t (sec) 200 (cz/1000 kms-1)2 s (“)
AO SBF Difficulties • Spatial PSF variation • Empirical and analytical PSFs can do the trick • Or, the other way around: can SBFs be used to assess the level of PSF variation? • Availability of natural guide stars • Need relatively bright stars to get good correction • Elliptical galaxy nuclei are typically too extended— M32 has a particularly high central surface brightness
5” NGC 7768 (100 Mpc)
Spatial Variation of the PSF A good PSF measurement is needed for SBF analysis: Note that the empirical PSF for NGC 7768 doesn’t quite match the data.
Spatial Variation of the PSF (Better PSF libraries, analytical PSF models, and deeper data to allow measurements at a larger range of radii from the AO guide star will help) A good PSF measurement is needed for SBF analysis: Model PSF composed of two Gaussians does better
Analytical PSF fit to M32 Very high-S/N spatial power spectrum for M 32 fitted with a model PSF composed of two Gaussians
Using SBFs to Measure PSF Variations • Point sources are pixel-to-pixel Poisson fluctuations, not individual stars, convolved with seeing • Does not rely on clean separation of PSF stars from neighbors (in fact, you want the stars blended!) • Power spectrum is statistical combination of many PSF measurements • Only M32 Hokupaa data is high enough in S/N over the whole field of view to be useful • NGC 7768 serves as a two-point test
e=0.35 104º e=0.2 81° e=0.25 68º e=0.05 110º
Summary • AO-corrected images can be used to measure SBFs in very distant galaxies • The spatial power spectrum of the fluctuations is proportional to the power spectrum of the PSF • Images of nearby bright, smooth galaxies (ellipticals or S0s) can be used to measure the spatial variation of the PSF core and halo, and the ellipiticity of the core.