Download
1 / 47
470 likes | 742 Views
Introduction to Hydrologic Processes - Rainfall & Streamflow - 2004. Dr. Philip B. Bedient Civil and Environmental Eng Rice University. Watershed Shapes. Important hydrologic characteristic Elongated Shape Concentrated Shape Affects Timing and Peak Flow

E N D
Introduction toHydrologic Processes - Rainfall & Streamflow - 2004 Dr. Philip B. Bedient Civil and Environmental Eng Rice University
Watershed Shapes • Important hydrologic characteristic • Elongated Shape • Concentrated Shape • Affects Timing and Peak Flow • Determined by geo - morphology of stream
Watershed - Elevation Contours Water flows at right angles to elevation contours and from higher to lower elevations
Subareas - divided according to topography and hydrology Sub A Outlet
Texas River Basins Red Trinity Colorado Brazos Rio Grande San Jacinto Hydrologic features with several different types of flow processes
Precipitation Water on Surface Overland Flow Channel Flow Reservoir Ground Water Ground Water Flow Ocean The Hydrologic Cycle
Sources of Rainfall • Severe Storms - Convective Cells • Low Pressure Systems - Hurricanes • Frontal Systems - Cold or Warm • Dew and Fog • Hail and Ice Storms • Condensation
Thunderstorm cell with lightning • Characterized by updrafts and downdrafts • Strong convergence and divergence
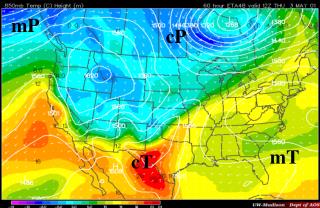
Causes of Precipitation Orographic lifting over mountain ranges Convective heating at or near surface - summer Frontal systems and buoyancy effects - winter
Fronts and Low Pressure • Cold/Warm Front • Lifting/Condensation • High and Low P • Rainfall Zone • Circulation Issues • Main weather makers
Track of Hurricane Andrew -1992 • Formed in the Atlantic • Moved directly to Florida • Winds in excess of 150 mph • $ 25B damage to Florida • Moved over Gulf and strengthened and hit LA
The Hyetograph • Graph of Rainfall Rate (in/hr) vs Time (hr) at a single gage location • Usually plotted as a bar chart of gross RF • Net Rainfall is found by subtracting infiltration • Integration of Net Rainfall over time = Direct RO Vol (DRO) in inches over a Watershed
Largest One Day U.S. Total Rainfall • Alvin, Texas • 43 inches in 24 hours • Measured in one gage • Associated with T.S. Claudette in July 1979 • Texas accounts for 12 world rainfall records
Tipping Bucket Rain Gage • Recording gage • Collector and Funnel • Bucket and Recorder • Accurate to .01 ft • Telemetry- computer • HCOEM website
Intensity-Duration-Frequency • IDF curves • All major cities • Based on NWS data • Various return periods & durations • Used for drainage design of pipes & roads • Used for floodplain designs - watersheds
Design Rainfalls • Design Storm from HCFCD and NWS • Based on Statistical Analysis of Data • 5, 10, 25, 50, 100 Year Events • Various Durations of 6 to 24 hours Six Hour Rainfall
T.S. Allison – Radar Data NEXRAD data is measured every 5 min over each grid cell as storm advances (4 km x 4 km cells) The radar data can be summed over an area to provide total rainfall depths 1 a.m.
T.S. ALLISON RADAR RAINFALL OVER BRAYS BAYOU WATERSHED 12 HOUR TOTALS BY SUBAREA
Thiessen Polygons - Avg P • Connect gages with lines • Form triangles as shown • Create perpendicular bisectors of the triangles • Each polygon is formed by lines and WS boundary • P = S (Ai*Pi) / A
Gage Averaging Methods • Arithmetic • Thiessen Polygon • Isohyetal Contours
Horton’s Infiltration Capacity f Horton (1933 - 1940) studied the response of different soils to application of water at varying rates Rate of rainfall must exceed the rate of infiltration and antecedent condition is an important parameter Sand > Silt > Clay
Horton’s Infiltration Concept f(t) = Rate of water loss into soil f = fc + (fo - fc) exp (-kt) fc = final rate value fo =initial rate value K = decay rate Can integrate to get F(t) = Vol of infiltration
STREAMFLOW Brays Bayou - Main St
Typical Streamflow Gage High Flow
Brays Bayou Flooding at Loop 610 Main Channel Overbank
Brays Bayou - T.S. Allison in June, TS TS Allison level reached 41.8 ft MSL TMC is at 44 ft & Rice Univ is at 50 ft
Stream Cross-Section for Q • Measure V (anemometer) at 0.2 and 0.8 of depth • Average V and multiply by (width * depth) • Sum up across stream to get total Q = S (Vi Di Wi)
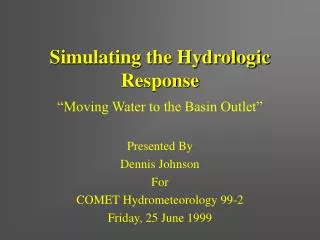
The Hydrograph • Graph of discharge vs. time at a single location • Rising Limb, Crest Segment, Falling Limb,and Recession • Base Flow is usually subtracted to yield DRO • Peak gives the maximum flow rate for the event • Area under curve yields volume of runoff (inches)
Small Basin Response • Rainfall falls over the basin • Rainfallreaches the outlet - response based on travel time • Produces a total storm response hydrograph as shown • Some delay and little storage • The above only occurs in small urban basins or parking lots Ii Small Basin Qi = CIi A
Rainfall and Runoff Response Flow Measured from USGS Gage 403 Inside Harris Gully Rainfall Measured from USGS Gage 400 at Harris Gully Outlet February 12, 1997 on Harris Gully Net Rainfall * Area = integration of direct runoff hydrograph Vol under blue bars * Area = Volume under red line (hydrograph)
Time-Area Method • Watershed travel times • Time Area Graph • Rainfall Intensities • Add and Lag Method • Resulting Hydrograph
Time Area Hydrograph Peak Flow at Q3 • Q1 = P1 * A1 • Q2 = P2*A1 + P1*A2 • Q3 =P3*A1 + P2*A2 + P1*A3 • And So Forth Each area contributes according to its time of travel and rainfall intensity
Hydrograph - Watershed Flow Response to Rainfall • Peak Flow and time to peak relate to area/shape of watershed • Area under curve is the volume of DRO • Time Base is time that flow exceeds baseflow • Time to peak or Lag is measured from center of mass of rainfall pattern Lag or time to peak Peak Flow Hydrograph RF Outflow Volume of Runoff DRO Time Base Time
Unit Hydrograph (UH) Method • 1 Inch of net rainfall spread uniformly over the basin • Response is unique for that basin and duration D • UH - from measurements • UH - Synthetic equations • Still used today for most watershed studies in U.S. Pi Uj Q T
UH for a Complex Rainfall • Linear transform method • Converts complex rainfall to streamflow at outlet • Produces a total storm hydrograph from given UH • Used in complex watersheds • Each subarea is uniform • Storage effects considered Pi Uj Q T Qn = Pn U1 + Pn-1 U2 + Pn-2 U3 + … +P1 Uj
Synthetic UH Methods Methods to characterize ungaged basins - 1938 Use data and relationships developed from gages Variety of approaches but most based on tp and Qp, Where tp=lag time (hr) and Qp = peak flow in cfs
Snyder’s Method 5 to 7 points
Hydrograph Convolution Add and Lag Method 1 2 0.5 1 2 STORM HYDRO 0.5 Add up the ordinates of all three to produce storm hydrograph
Hydrograph Flood Routing to Next Downstream Location Crest 1 Falling Limb Rising Limb 2 Recession Time Base of Hydrograph Flood wave is lagged and attenuated as it moves downstream