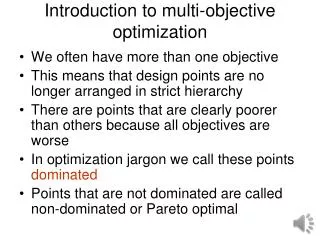
Multi-Objective Optimisation (II)
Multi-Objective Optimisation (II). Matthieu Basseur. Outlines. Motivations Evolutionary Multiobjective Optimisation Quality indicators Indicator-Based Evolutionary Algorithm Multiobjective Local Searches Indicator-Based Local Search Hypervolume-Based Optimisation


Multi-Objective Optimisation (II)
E N D
Presentation Transcript
Multi-Objective Optimisation (II) Matthieu Basseur Angers, 10 June 2010
Outlines • Motivations • Evolutionary Multiobjective Optimisation • Quality indicators • Indicator-Based Evolutionary Algorithm • Multiobjective Local Searches • Indicator-Based Local Search • Hypervolume-Based Optimisation • Conclusions and perspectives
Introduction • About me…. • 2001-2005: PhD in Lille (France) – supervisor E-G. Talbi • Research visitor in ETH Zurich/Switzerland (2005) – with E. Zitzler • 2006-2007: Research Assistant at Nottingham University/England • Since September 2007: Assistant Professor (University of Angers) • Research interests • Main area: multiobjective optimisation • Metaheuristics for multiobjective optimisation (GAs, Local Search, Memetic algorithms, Path relinking, and also exact methods) • Hybrid and adaptive metaheuristics (cooperation, parallelism) • MO optimisation under uncertainty • Applications (continuous test functions, flow-shop problem, routing problem…) • Motivations • Mainly linked to my previous research activities
MultiObjective Optimisation (I) …by V. Barichard two weeks ago! • Single objective optimisation • Optimisation problems • Resolution approaches • Multiobjective optimisation problems • Description • Dominance relation • Resolution approaches and result evaluation • Resolution approaches • Pareto dominance based algorithms • Outputs comparison • Today: new trends in MOO
Motivations • Efficients optimisation algorithms are often: • Complex • Complex mechanisms (diversification, evaluation…) • Hybrid algorithms • Parameters-dependant • Numerous • Great influence on the results (setted by hand, or adaptive setting) • Dependant to the size of the problem • Dependant to the problem treated • Need of generic algorithms which are: • Simple • Adaptable to a range of optimisation problems • Small number of parameters • …but efficient! Design of generic multi-objective metaheuristics Problem specific optimisation
Outlines • Motivations • Evolutionary Multiobjective Optimisation • Quality indicators • Indicator-Based Evolutionary Algorithm • Multiobjective Local Searches • Indicator-Based Local Search • Hypervolume-Based Optimisation • Conclusions and perspectives
Multiobjective optimisation Non-dominated solution Dominated feasible solution f f g 1 2 e a b f c Goal: Find a good quality and well diversified set of non-dominated solutions • Pareto Dominance • y dominates z if and only if i[1, …, n], yi zi and i[1, …, n], yi < zi • Non-dominated solution • A solution x is non dominated if a solution which dominates x does not exist
Multiobjective optimisation Non-dominated solution Dominated feasible solution f f g 1 2 e a b f c Goal: Find a good quality and well diversified set of non-dominated solutions • No total order relation exist ( from single objective case) • We can not compare solution a={4,7} with solution b={8,5}. • Resulting specific questions • How to assign fitness of solutions in evolutionary algo. (for selection)? • How to find good compromise solutions? • How to evaluate different outputs obtained by different algorithms?
Evolutionary Multiobjective Optimisation? f 2 f 1 • Multiobjective Optimisation : find a set of compromise solutions • Evolutionary Algorithms (EAs) : evolve a set of solutions. • EAs are naturally wellsuited to find multiple efficient solutions in a single simulation run • a tremendous number of multiobjective evolutionary algorithms have been proposed over the last two decade.
Multiobjective Fitness assignment • Fitness assignement : central point of (population-based) multiobjective metaheuristics Generic population-based search algorithm: Create initial population P repeat generate a new solution x add x to the population P evaluate fitness of solution x (and update P?) delete the worst solution of P until termination criteria is verified return P Need to ‘rank’ solutions
Until mid 80’s: agregation of objective functions Now: Pareto dominance based ranking methods (dominance depth, counter of dominance…) Multiobjective Fitness assignment σ σ f + f 1 1 2 2 Convex hull f 2 f 1
Dominance depth [Srinivas & Deb 94] Multiobjective Fitness assignment f 2 Rk=3 Rk=2 Rk=1 f 1
Counter of dominance [Fonseca & Flemming 93] Multiobjective Fitness assignment f Rk=7 2 Rk=0 Rk=1 Rk=3 Rk=4 Rk=0 Rk=3 Rk=0 Rk=1 Rk=0 f 1
Sum of ranks ≈[Bentley & Wakefield 97] Multiobjective Fitness assignment RK=16 RK=8 RK=9 1 RK=11 RK=13 + 4 RK=5 RK=12 RK=5 RK=7 RK=4 f 2 f 1
Multiobjective Fitness assignment • Pareto dominance ranking methods drawbacks • Binary value - No quantification of the dominance • Comparison is difficult if to many Pareto solutions can be generated (need to add clustering tool). • General goal of MO optimisation: « Find a good quality and well diversified set of non-dominated solutions » • How to achieve this? • Define indicators which are able to evaluate a set of solutions • Optimise the indicator value during the search
Outlines • Motivations • Evolutionary Multiobjective Optimisation • Quality indicators • Indicator-Based Evolutionary Algorithm • Multiobjective Local Searches • Indicator-Based Local Search • Hypervolume-Based Optimisation • Conclusions and perspectives
Quality indicators f f 1 2 • Usefull to compare two (or more) optimizers • How to compare set A against set B? ? Approximation A Approximation B
Quality indicators f f 1 2 • Definition (Quality indicator):An m-ary quality indicator I is a function, which assigns each vector (A1,A2, … , Am) of m approximation sets a real value I(A1,…, Am) [Zitzler 2005]. Approximation A Approximation B
Quality indicators • Definition (Quality indicator):An m-ary quality indicator I is a function, which assigns each vector (A1,A2, … , Am) of m approximation sets a real value I(A1,…, Am) [Zitzler 2005]. • Unary indicator : I(P1),…, I(Pm) compare real values. • Binary indicator : I(P1,P2) compare two sets! • Comparison of m outputs: Use a reference set (e.g. the best known Pareto set) and compare each output against the reference set • Many research on this subject – many indicators: • hypervolume indicator, ε-indicator, average best weight combination, distance from reference, error ratio, chi-square-like deviation indicator, spacing, generational distance, maximum Pareto front error, maximum spread, coverage error, Pareto spread… [Zitzler 2005]
ε-indicator I (A,B) I (B,A) f f ε ε 1 2 • Binary indicator epsilon [Zitzler & Kuenzli 04] • I (A,B)= Minimal translation to apply on the set A so that every solution in set B is dominatedby at least as one solution in A. Normalized space
ε-indicator I (A) f f ε 1 2 • Unary indicator version of binary indicator epsilon • I (A)= Minimal translation to apply on the set A so that every solution in a reference set R is dominatedby at least as one solution in A. Normalized space
Hypervolume indicator f f 1 2 • Also known as S-metric, lebesgue’ measure… • Hypervolume enclosed by approximation A according to a reference point Z Approximation A
Hypervolume indicator f f 1 2 • Also known as S-metric, lebesgue’ measure… • Hypervolume enclosed by approximation A according to a reference point Z Z Approximation A
Hypervolume indicator I (A) f f HD 1 2 • Also known as S-metric, lebesgue’ measure… • Hypervolume enclosed by approximation A according to a reference point Z Z Normalized space Approximation A
Hypervolume indicator I (A,B) I (B,A) f f HD HD 1 2 • Hypervolume as binary indicator [Zitzler & Kuenzli 04] • Hypervolume enclosed by approximation A and not by approximation B, according to a reference point Z Z Normalized space Approximation A Approximation B
Outlines • Motivations • Evolutionary Multiobjective Optimisation • Quality indicators • Indicator-Based Evolutionary Algorithm • Multiobjective Local Searches • Indicator-Based Local Search • Hypervolume-Based Optimisation • Conclusions and perspectives
IBEA principle • Fitness assignment: • Define a binary indicator I which allows to compare two solutions • When a solution x is added to a population P • Compare x against every solution in P using indicator I to compute x fitness • For each solution S in P, update fitness according to I and x • Selection • Delete the solution which have the worst fitness value
From binary indicator to fitness assignment I (a,b)>0 I (b,a)>0 f f f f f f f f 1 1 2 1 2 2 2 1 HD HD a a b I (b,a)=-I (a,b)>0 HD HD b a a I (a,b)>0 I (a,b)>0 ε ε b b I (b,a)<0 ε I (b,a)>0 ε
From binary indicator to fitness assignment Binary indicator value of a population against a single solution: I (a,b)>0 I (b,a)>0 f f f f f f f f 2 2 1 2 1 1 2 1 HD HD a a b I (b,a)=-I (a,b)>0 HD HD b a a I (a,b)>0 I (a,b)>0 ε ε b b I (b,a)<0 ε I (b,a)>0 ε
Indicator-Based Evolutionary Algorithm • IBEA principles [Zitzler & Kuenzli 2004] • Define a binary indicator I and an initial population P of n solutions • Generate a set Q of m new solutions using genetic operators • Select a set R of N solutions from Q U P, which minimize I(Q U P,R) • Repeat until termination criteria verified return R • Advantages • Outperforms NSGA-II and SPEA2 on continuous test functions • Small number of parameters (population size, m, binary indicator) • No diversity preservation mechanism required • Could take into account the decision-maker preference • But… • Delete optimaly m solutions from a population is difficult (greedy in IBEA) • Evolutionary algorithm convergence is usualy slow
But… Cut m solutions IBEA: Delete 1 by 1 ES(n,1) : 1 to delete f f f 2 2 2 f f f 1 1 1 • Delete optimaly m solutions from a population is difficult (greedy in IBEA) • Evolutionary algorithm convergence is usualy slow • local search methods are known to be efficient metaheuristics for single-objective optimization… application to MOO?
Outlines • Motivations • Evolutionary Multiobjective Optimisation • Quality indicators • Indicator-Based Evolutionary Algorithm • Multiobjective Local Searches • Indicator-Based Local Search • Hypervolume-Based Optimisation • Conclusions and perspectives
Single Objective Local Search • Evaluate solutions « arround » an initial one, and select a solution which is better. • Efficient heuristic, easy to understand and to implement. Several • Neighborhood • Improvement strategy (first, best) • Iterated version (random pop., or other strategy) x2 f(x) x1 Solution space
MO Local searches issues • Difficulties resulting from the multiobjective aspect of the problems. • Initialisation (random?) • Solution Evaluation (agregation, Pareto, indicator) • Neighborhood (related to all objectives?) • Neigh. Exploration (partial, 1st improvement, best imp.) • Selection strategy (all improvements, dominance…) • Population size (unique solution, fixed or variable size) • Archive of best known? • Iteration (re-initialisation) • Stopping criterion (progress threshold, entire set in local optima?) • …
MO Local searches example : PLS f f 1 2 • Classical and intuitive dominance-based MO local search [Talbi et al. 2001] [Basseur et al. 2003] [Angel et al. 2004] • Different versions : stopping criterion, archive, selection strategy… • Problems : • non-dominated solution are incomparable • variable population size (can be huge) Indicator-Based MO Local Search!
Outlines • Motivations • Evolutionary Multiobjective Optimisation • Quality indicators • Indicator-Based Evolutionary Algorithm • Multiobjective Local Searches • Indicator-Based Local Search • Hypervolume-Based Optimisation • Conclusions and perspectives
Indicator-Based MO Local Search • Initialisation of the population P of size N • Fitness assignment • For each x є P, Fitness(x)=I(P\{x},x) • Local search Step: for all x є P do • x* one random neighbour of x • Fitness(x*)=I(P,x*) • For each z є P, update its Fitness: Fitness(z)+=I(x*,z) • Remove w, the solution with minimal Fitness value in P U x* • Repeat until all neighbours tested, or w≠x* (new solution found) • Stopping criterion: no new non-dominated solution found during an entire local search step: return the set of non-dominated solutions of P. Iterated IBMOLS: repeat the process, with different initial populations
Parameters: indicators • Binary indicators issued from performance assessment studies: • Iε[Zitzler & Kuenzli 04] • IHD [Zitzler & Kuenzli 04] • Comparison with classical dominance-based ranking methods, adapted into indicators: • IBen [Bentley & Wakefield 97] • ISri [Srinivas & Deb 94] • IFon [Fonseca & Flemming 93]
Parameters: indicators f 1 f 2 Rk=3 Rk=2 Rk=1 f 1 • Binary indicators issued from performance assessment studies: • Iε[Zitzler & Kuenzli 04] • IHD [Zitzler & Kuenzli 04] • Comparison with classical dominance-based ranking methods, adapted into indicators: • IBen [Bentley & Wakefield 97] • ISri [Srinivas & Deb 94] • IFon [Fonseca & Flemming 93]
Parameters: indicators f 1 f Rk=7 2 Rk=0 Rk=1 Rk=3 Rk=4 Rk=0 Rk=3 Rk=0 Rk=1 Rk=0 f 1 • Binary indicators issued from performance assessment studies: • Iε[Zitzler & Kuenzli 04] • IHD [Zitzler & Kuenzli 04] • Comparison with classical dominance-based ranking methods, adapted into indicators: • IBen [Bentley & Wakefield 97] • ISri [Srinivas & Deb 94] • IFon [Fonseca & Flemming 93]
f 2 Parameters: indicators f 1 RK=16 RK=8 RK=9 1 RK=11 RK=13 RK=5 + 4 RK=12 RK=5 RK=7 RK=4 with • Binary indicators issued from performance assessment studies: • Iε[Zitzler & Kuenzli 04] • IHD [Zitzler & Kuenzli 04] • Comparison with classical dominance-based ranking methods, adapted into indicators: • IBen [Bentley & Wakefield 97] • ISri [Srinivas & Deb 94] • IFon [Fonseca & Flemming 93]
Parameters: population initialisation • Rand:Generate a set Pof sizen of random permutations. • Cross:Apply a classical crossover operator to pairs of solutions selected from the archive Aof sizem of non-dominated solutions. • If 2n<m, then select randomly 2n solutions from A. • If 2n≥m, then select A, and complete with random solutions. Create n new solutions by applying crossover on the 2n selected solutions. • SA: Random noise applied on archived solutions. • If n<m, then select randomly n solutions from A. • If n≥m, then select A, and complete with random solutions. Create n new solutions by applying random noise (mutations) on the n selected solutions.
Application: Ring Star problem Ring cost Assignment cost Minimise • Applications in telecommunication network design and transit systems planning. • Problems from 70 to 300 locations
Application: Nurse Scheduling • QMC NURSE SCHEDULING PROBLEM: process of timetabling staff (allocating nurses to working shifts) over a period of time. • Hard constraints to satisfy • 3 Objective functions: minimise the violation of 3 soft constraints • violations of “SingleNight, WeekendSplit, WeekendBalance” • number of violations of “Coverage” • penalty for “CoverageBalance” • Problem details: • Ward of 20 to 30 nurses • Planning period is 28 days, with 3 shift types: day, evening and night • Full time/Part time nurses (e.g. 8h, 15h, 23h, 30h, 40h…) • Nurses hierarchy, according to their qualifications and training • Coverage demand is different for each shift • Working regulations to be satisfied (e.g. annual leave)
Application: Biobjective Flow-shop problem M1 M2 M3 Cmax • N jobs to schedule on M machines • Critical ressources • Permutation flow shop • Objectives to minimise : • Cmax : Maximum completion time • T : Sum of tardiness (or average tardiness) • Taillard’ Benchmarks [Taillard 93] , extended to thebiobjective case _ _ T
Parameters / Performance assessment • Binary quality indicators: • Iε, IHD [Zitzler & Kuenzli 04] • Comparison with classical dominance-based ranking methods, adapted into indicators: IBen [Bentley & Wakefield 97], IFon [Fonseca & Fleming 93], ISri [Srinivas & Deb 94] • Population size: small fixed values (3, 5, 8, 10, 20, 30, 50) • Population initialisation: Random, Crossover on solutions in the archive, Random noise on archived solutions (Simulated Annealing) • 20 runs on each instance, short run time (20” to 20’) • Performance assessment • Hypervolume indicator difference of the different sets of non-dominated solutions obtained • Statistical analysis (Mann-Withley test) Z
Results : table analysis • For each algorithm : • 20Hypervolume indicator differences computed from the 20 runs • Tables show the average value for each pair algorithm/instance • Stastistical analysis : • Rank the differents runs of two different algorithm • Using Hypervolume difference • Mann-Withley test: compute the confidence level that the obtained classification is not hazardous • Results in bold: algorithm never outperformed by another algorithm with a confidence level greater than 95%
Results • Indicator sensitivity • Superiority of performance assessment based indicators over dominance based indicators • Superiority of epsilon indicator over hypervolume indicator
Results • Initialisation strategy sensitivity • Superiority of Simulated annealing (random mutations) initialisation • Optimal noise rate around 10%
Results • Population size sensitivity • Best performance obtained with small population size • Optimal population size increases with the size of the problem considered