Electronics Diagram
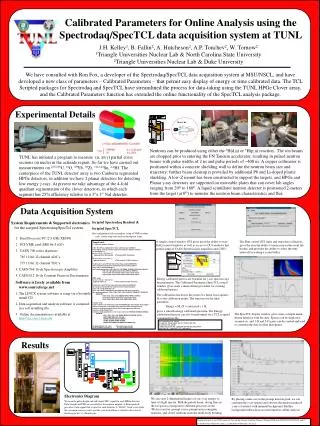
Detector. Spec Amp. LOGIC. TDC. ADC. CFD. TDC START. Det 1 Shield Veto. TF Amp. System MasterGate. DETECTOR Mastergate. ADC START. VETO. EVENT START Mastergate.Live. Busy Latch. DETECTOR Mastergate Scaler. Computer Inhibit. DETECTOR Trigger Scaler. Mastergate. System

Electronics Diagram
E N D
Presentation Transcript
Detector Spec Amp LOGIC TDC ADC CFD TDC START Det 1 Shield Veto TF Amp System MasterGate DETECTOR Mastergate ADC START VETO EVENT START Mastergate.Live Busy Latch DETECTOR Mastergate Scaler Computer Inhibit DETECTOR Trigger Scaler Mastergate System Mg.LIVE Scaler OR Event Done from VME Other Detectors System MasterGate Scaler Initiate a calibration. 2H(d,n)3He Save fits and calibrations Id =1mA beam pickoff 7.8 atm Read a file of fits and calibrations. J.H. Kelley1, B. Fallin2, A. Hutcheson2, A.P. Tonchev2, W. Tornow21Triangle Universities Nuclear Lab & North Carolina State University2Triangle Universities Nuclear Lab & Duke University Calibrated Parameters for Online Analysis using the Spectrodaq/SpecTCL data acquisition system at TUNL We have consulted with Ron Fox, a developer of the Spectrodaq/SpecTCL data acquisition system at MSU/NSCL, and have developed a new class of parameters – Calibrated Parameters – that permit easy display of energy or time calibrated data. The TCL Scripted packages for Spectrodaq and SpecTCL have streamlined the process for data-taking using the TUNL HPGe Clover array, and the Calibrated Parameters function has extended the online functionality of the SpecTCL analysis package. Experimental Details Neutrons can be produced using either the 2H(d,n) or 3H(p,n) reaction. The ion beams are chopped prior to entering the FN Tandem accelerator, resulting in pulsed neutron beams with pulse widths of 2 ns and pulse periods of ~400 ns. A copper collimator is positioned within a concrete shielding wall to define the neutron beam size and trajectory; further beam cleanup is provided by additional Pb and Li-doped plastic shielding. A low-Z mount has been constructed to support the targets, and HPGe and Planar g-ray detectors are supported on moveable plates that can cover lab angles ranging from 20O to 160O. A liquid scintillator neutron detector is positioned 2-meters from the target (at 0O) to monitor the neutron beam characteristics and flux. TUNL has initiated a program to measure (n, xn g) partial cross sections on nuclei in the actinide region. So far we have carried out measurements on 235,238U, 16O, 89Yb, 90Zr, 112,124Sn, natHf. The centerpiece of the TUNL detector array is two Canberra segmented HPGe detectors, in addition we have 2 planar detectors for detecting low energy g-rays. At present we take advantage of the 4-fold quadrant segmentation of the clover detectors, in which each segment has 25% efficiency relative to a 3”x 3” NaI detector. Data Acquisition System Scripted Spectrodaq Readout & Scripted SpecTCL One configuration file streamlines setup of VME readout code, scalar setup and analyzer histogram setup. • System Requirements & Supported electronics for the scripted Spectrodaq/SpecTcl system • Dual Processor PC (2.8 GHz XEON) • PCI-VME card (SBS bit-3 620) • CAEN 700 series digitizers • 785 12-bit 32 channel ADC’s • 775 12-bit 32 channel TDC’s • 4. CAEN 568 16-ch Spectroscopic Amplifier • 5. CAEN 812 16-ch Constant Fraction Discriminator • Software is freely available from www.sourceforge.net • The LINUX system software is setup via a bootable install CD • Data acquisition and analysis software is contained in a self installing file. • Online documentation is available at http://docs.nscl.msu.edu The Run control GUI starts and stops data collection, gives the user the ability to name runs in the event file header, and provides the ability to select the time interval for writing a scaler buffer. A simple control window GUI gives users the ability to start DAQ control windows as well as access to GUI windows that permit setup of CAEN Spectroscopic amplifiers and CFD’s Sample code # Setup the readout software. # The first 785 is configured for base addressing at e5000000 # thresholds set as per thrlist single vent mode all channels enabled set thresholds 15 for {set i 0} {$i < 32} {incr i} { lappend thrlist $thresholds # Common ADC thresholds. } for {set i 0} {$i < 31} {incr i} { lappend enables 1; # This enables 32 ADC channels. } module adc1 caenv785 slot 5 geo false base [expr 0xe6000000] adc1 config threshold $thrlist multievent false enable $enables catch "adc1 config waitloops 1" adc1 config parameters {1Q1 1Q2 1Q3 1Q4 5MON_E 5MON_PSD blank1 blank2\ 2Q1 2Q2 2Q3 2Q4 blank3 blank4 3EHPGe 4EHPGe \ a1p17 a1p18 a1p19 a1p20 a1p21 a1p22 a1p23 a1p24\ a1p25 a1p26 a1p27 a1p28 a1p29 a1p30 a1p31 a1p32} #TDC setup for {set i 16} {$i < 32} {incr i} { lappend tnables 0; # This enables 32 TDC channels. } module tdc caenv775 slot 9 geo false base [expr 0xe3000000] tdc config threshold $thrlist multievent false enable $tnables catch "tdc config waitloops 10" catch "tdc config commonstart true keepoverflow false range 410" tdc config parameters {1TQ1 1TQ2 1TQ3 1TQ4 1SHIELDT 2SHIELDT3SHIELDT 4SHIELDT \ 2TQ1 2TQ2 2TQ3 2TQ4 5MONT BPM 3THPGe 4THPGe \ t1p17 t1p18 t1p19 t1p20 t1p21 t1p22 t1p23 t1p24 \ t1p25 t1p26 t1p27 t1p28 t1p29 t1p30 t1p31 t1p32} # Scaler setup scaler counters caenv830 base [expr 0xee000000] geo false header false trigger 1 counters config slot 11 packetize false autoreset false manualclear true counters config fpclearmeb false id 0x101 vmetrigger true wide true counters config header false counters config parameters {1_Q1 1_Q2 1_Q3 1_Q4 1SHIELD 2SHIELD 3SHIELD 4SHIELD \ 2Q1 2_Q2 2_Q3 2_Q4 5MON 5MONLIVE 3HPGE 4HPGE \ 0RAW 0MG 0MGLIVE sBLANK \ 1DRAW 2DRAW 3DRAW 4DRAW \ 1D1MG 2D2MG 3D3MG 4D4MG\ 1DMGLIVE 2DMGLIVE 3DMGLIVE 4DMGLIVE} set ModuleOrder {tdc adc1} ;# Readout/unpack order. set ScalerOrder {counters}; # scaler readout order. Energy calibrated spectra are essential for g-ray spectroscopy measurements. The Calibrated Parameters SpecTCL control window gives users a menu driven procedure for creating calibrated spectra. The calibration function is the result of a linear least-squares fit to the calibration points. The function for the final parameter, Energy = Mi (X + ran(iseed) ) + Bi, gives a smooth energy calibrated spectrum. The Energy calibration function can also be performed via a TCL scripted command-line file. The SpecTCL display window gives users a simple menu-driven interface with the data. Spectra can be displayed, zoomed etc. and 1-D and 2-D gates can be created and used to constrain the data in other histograms. fit -create linear 1Q1_CALIB fit -add 1Q1_CALIB {402.0 186.21} {2794.0 1764.515} fit -perform 1Q1_CALIB calibparam -create 1Q1_calibrated 101 1Q1 1Q1_CALIB keV spectrum 1Q1_calibrated 1 1Q1_calibrated 12 Results Electronics Diagram We record a pulse-height and self-timed TDC signal for each HPGe detector. Pulse-height and PSD are recorded for the neutron monitor. A Beam-pickoff provides a time signal that is used for each detector. A “BUSY” latch is set while the system processes events, and the system deadtime is related to the ratio of #mastergate.live vs. #mastergate We can view 2-dimensional figures of our g-ray energy vs. time-of-flight spectra. With the pulsed beam, strong lines in the tof spectra correspond to different processes in the 2H(d,n) reaction: prompt g-rays, prompt mono-energetic neutrons, and slower neutrons from the multi-body breakup. By placing a time cut on the prompt neutron peak, we can constrain the g-ray spectra and observe the neutron-induced g-rays of interest with minimal background. Further background subtractions are performed in offline analysis. Supported in part by the NNSA under the Stewardship Science Academic Alliances Program DOE grant #DE-PS52-05NA25930, and by DOE DE-FG02-97ER41033 (Duke) and DE-FG02-97ER41042 (NC-State).