Download
1 / 23
230 likes | 251 Views
Explore the hydrology of the Jordan River Basin, including watershed delineation, volume of water available for run-off, and the delicate water balance of the Dead Sea. Learn about transboundary catchments, contributions of countries, and annual precipitation. Discover the impact on the Dead Sea water levels and the ongoing challenges. Get comprehensive insights and data analysis on this vital region.

E N D
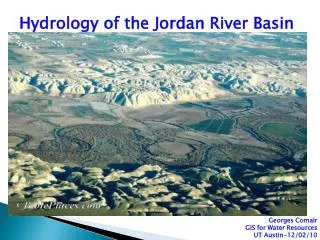
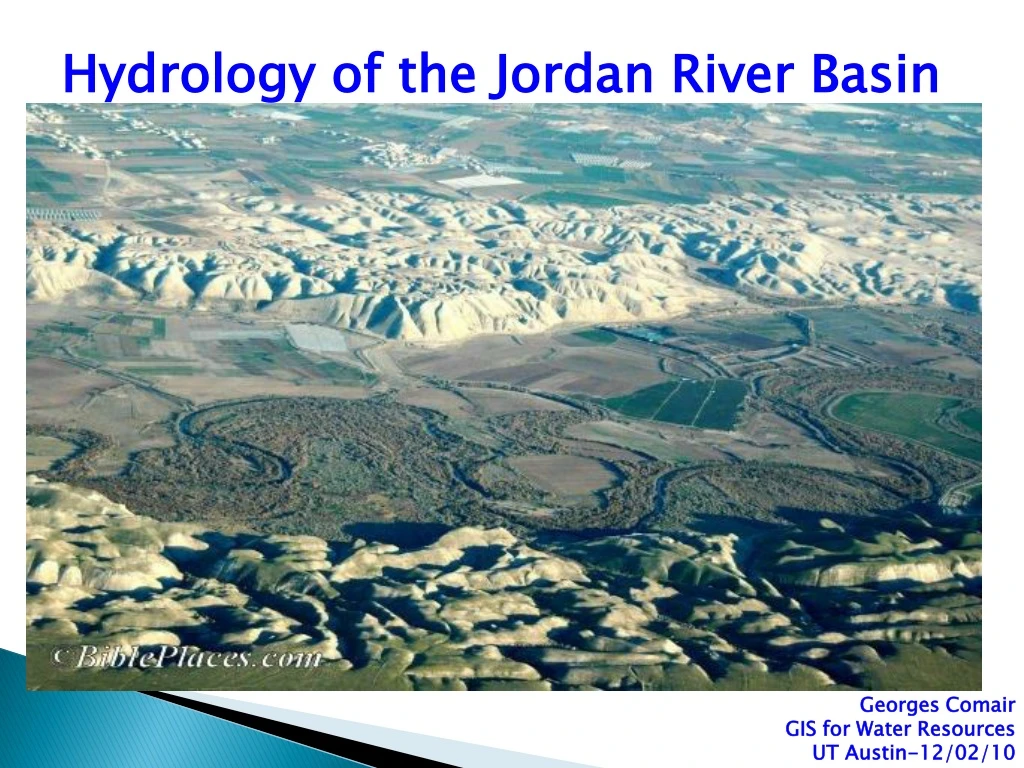
Hydrology of the Jordan River Basin Georges Comair GIS for Water Resources UT Austin-12/02/10
Preview • Location • Watershed delineation • Volume of water available for run-off • Dead Sea water balance
Location NASA
The upper Jordan River catchment Jordan River wikipedia googleEarth
Rivers of the upper Jordan Basin Snir (Hasbani) Hermon (Banias) Dan wikipedia wikipedia wikipedia
Drainage directions from Hydrosheds 15 sec DEM
Flow accumulation HydroSHEDS World Basins Clipped DEM
Check the total basin area 18,261 km2
Subwatersheds for each country Lebanon Israel
Average annual precipitation for the globe on a 0.5 X 0.5 degree global grid
The Dead Sea water balance deadseabody.com meddead.org/Save_Dead_Sea.html
Results and comparison “The rate of water level drop over the last 10 years is about 0.9 m/yr, representing an annual water deficit of about 600 million cubic meters” Itay Gavrieli, 2005
QUESTIONS ? Jerusalemperspective.com