Disclosure control Denmark
70 likes | 87 Views
This presentation discusses the general rules and guidelines for disclosure control in Denmark, focusing on grid and street level data. It includes examples of clustering and segmentation techniques used to protect individual data while still providing meaningful insights. Presented at the Nordic Forum for Geography and Statistics (NFGS) in Stockholm, September 2015.

Disclosure control Denmark
E N D
Presentation Transcript
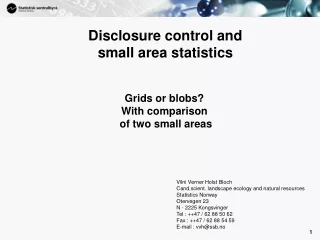
Disclosure controlDenmark Nordic Forum for Geography and Statistics (NFGS) Stockholm, September 2015.
Disclosure control in Denmark • General rule is no individual data about persons, families, households, companies etc. • All data should be aggregated. • So if one is not a good number then two is also not a good number since you might be the one of the two – in that case there should at least be 3 observations in for example a table cell. • Difference between handling of statistics for population and for business.
Two examples of disclosure handling • Grid data – example 1. • Street level data – example 2.
Grid data – confidentiality • Night time population with persons and households for 100x100 meter cells without any requirement for disclosure. • Day time population with number of employed persons or students at workplaces for 100x100 meter cells without any requirement for disclosure. • All other variables requires clustering of data.
Grid data – clustering of data • Clusters with a minimum of households in a number of 100x100 meter cells. • Clusters either based on proximity or optimization. • Clusters either made first (static “fixed” clusters) or last (dynamic “flexible” clusters). • Number of households based on the granularity of data. • Example with income (static “fixed” clusters) • Minimum 20 households: average income • Minimum 50 households (3 levels), minimum 100 households (6 levels) and minimum 150 households (9 levels).
Grid data – clustering of data • Clusters with optimization (dynamic “flexible” clusters). • Segmentation example with income: • Minimum 300 households in clusters: average income (falling average). • 100x100 meter grid cells with a minimum of 5 households and micro clusters with a minimum of 5 households are included. • Breakdown of municipalities. • Cluster no. 1 in a municipality is the cluster with minimum 300 households with the highest average income.
Street level data - houselevel • Clusters with optimization (dynamic “flexible” clusters). • Segmentation example with income: • Minimum 400 households in clusters: average income (falling average). • Streets with a minimum of 5 households. Streets divided in to even or odd numbers if minimum 5 households. Side of streets divided again if possible. • Breakdown of municipalities. • Cluster no. 1 in a municipality is the cluster with minimum 400 households with the highest average income.