Download
1 / 1
10 likes | 156 Views
I dentification and separation of reference-free spectral EEG components: Combining Current Source Density (CSD) and frequency Principal Components Analysis (fPCA) Craig E. Tenke and Jürgen Kayser Department of Biopsychology, New York State Psychiatric Institute, New York.

E N D
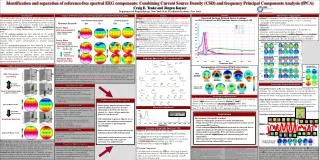
Identification and separation of reference-free spectral EEG components: Combining Current Source Density (CSD) and frequency Principal Components Analysis (fPCA) Craig E. Tenke and Jürgen Kayser Department of Biopsychology, New York State Psychiatric Institute, New York • Factor 1 is a prominent (26.53% variance) low alpha factor that overlaps theta. It has a posterior/inferior topography, as well as a secondary topography on the frontal midline. • Factor 3 is a prominent (18.11%) high alpha factor with a medial parietal topography. • Factor 5 also has a medial parietal topography, is intermediate in frequency, and less prominent than the others (7.43%). • These three alpha factors showed a condition dependence and consistent topographies across four groups of participants [i.e., two independent samples of healthy adults (DC,CE) and depressed patients (DD,DE)]. Results Alpha Factor Topographies Subjects:N =143 right-handed adults (n = 63 healthy adults and n = 82 clinically depressed outpatients, pooled across two separate studies) Recordings: Resting 30-channel EEG from four 2-min time periods (order of eyes open/closed counterbalanced as OCCO or COOC across subjects), referenced to nose tip (Grass, 10K gain; 0.1 - 30 Hz band pass; recorded using NeuroScan at 200 samples/s); vertical and horizontal EOG recorded differentially Signal processing: Data were segmented into 1.28 s epochs (50% overlap), yielding a frequency resolution of 0.78 Hz; artifactual data eliminated from epoched data under visual guidance (semi-automated procedure) CSD:CSD waveforms were computed for each accepted epoch using the spherical spline method of Perrin et al. (1989) [lambda = 10-5; 50 iterations; m = 4) Spectral Analysis: Hanning window (50%) applied to each CSD epoch; mean Power Spectra (PS) computed across epochs for each condition (i.e., eyes open/ closed), and subsequently converted to a RMS Amplitude Spectra (square root of Power Spectra, proportional to the amplitude of an underlying sinusoid) fPCA: Amplitude Spectrum data from 0-77.2 Hz (100 points = 100 variables) submitted to unrestricted covariance-based Principal Components Analysis, using electrodes (31) x Conditions (2) x participants (145) as 8990 cases, followed by unscaled Varimax rotation (Kayser & Tenke, in press) Methods Unscaled Varimax Rotated Factor Loadings for fPCA Computed from RMS Amplitude Spectra of temporal CSD http://psychophysiology.cpmc.columbia.edu 4.5 4.0 3.5 3.0 2.5 2.0 Consistency of Factor Topography across Groups and Studies 1.5 Factor 1 Closed 1.0 -0.5 0.0 +1.0 -0.5 0.0 +1.0 Eyes 0.5 Open 0.0 Controls Depressed DC (24) CE (27) DD (58) DE (36) Factor 3 Amplitude Spectra of CSD from Resting EEG -.5 Closed -0.5 0.0 +1.0 -0.5 0.0 +1.0 nose 0.0 Eyes 10.0 20.0 eyes 30.0 40.0 50.0 60.0 70.0 eyes Impact of Reference on Frequency Spectra Frequency [Hz] Fp1 Fp2 Open Fpz Cz Reference Electrode Controls Depressed DC (24) CE (27) DD (58) DE (36) Pz Factor 5 Cz F7 F3 Fz F4 F8 EEG Time series Pz Closed Fz -0.5 0.0 +1.0 -0.5 0.0 +1.0 Cz Signal Amplitude [uV] Fpz Eyes [real numbers] Fz Open FT9 FC5 FC6 FT10 Fpz Controls Depressed DC (24) CE (27) DD (58) DE (36) Time [ms] Time [ms] Reversible Transformation T7 C3 Cz Cz C4 T8 Grouped by Factor 1 at Fz: Low Alpha (Factor 1) had a secondary Fz maximum. The secondary frontal topography was seen for individuals in both two replications using two groups. A consistent topography was also observed for subjects with high, medium or low Factor 1 scores at Fz. Single Epoch for Representative High Fz Subject: Posterior and frontal midline Alpha topographies of Factor reflect linked, inverted current generators. The sharpness of the frontal midline topography suggests local field closure, as would be produced by an opposed pair of simultaneous regional dipoles. Inferior and Frontal Generators? CET • The volume conduction of field potentials from neuronal generators approximates Ohm’s Law for a conductive medium, varying linearly over distance • Concurrent generators produce additive field potential effects • Linear EEG properties are preserved in the frequency domain: Fourier transformation is linear and reversible, but complex-valued Linear Properties of EEG Fourier Spectrum [uV] Pz Pz Fourier transformation Cz Cz Fz TP9 CP5 CP6 TP10 Fz Fpz Grouped by Factor 1 at Fz Fpz [complex numbers] -1 Freq [Hz] Freq [Hz] P9 P7 P3 Pz P4 P8 P10 0 Low -2 -2 -2 +1 -7 -7 -1 O1 Oz O2 0 0 0 Med 0 [Fourier Map at 10 Hz] 0 0 • Power Spectra impede inferences about underlying EEG generators, because information is lost when the data are squared (i.e., linear volume conduction properties not preserved) • CSD calculation (Laplacian, Hjorth, etc.) is impossible after nonlinear transformation (i.e., the measure is physiologically unintelligible) • Power estimates are not proportional to the underlying (linear) EEG field potentials • Logarithmic transformations correct skew of Power Spectrum, but exaggerate systematic, low amplitude noise Problems with EEG Power Spectra +1 -1 • Based on simplifications of Poisson's equation, relating current generators to the negative spatial derivative of the field potential in a conductive medium • Removes volume-conducted activity • Provides a concise, reference-free simplification of a field topography • Indicates neuronal depolarization as a current sink (negativity), repolarization or hyperpolarization as a current source (positivity) • Estimates are real (magnitude and sign) Properties of CSD 0 +7 +7 Waveform Comparison +3 +3 High +3 +1 2 Irreversible Transformation 12 eyes closed:Pz, P8, Fzeyes open: Fz 9 • The combined CSD and fPCA method: • Improves topographic specificity over EEG field potentials • Yields reference-free spectral measures similar in form to those used in conventional EEG analyses • Yields orthogonal Spectral Factors consistent with the analyzed data as opposed to simple, predetermined rectangular frequency bands • Automatically removes EMG, EOG and electrical artifacts • Provides replicable Alpha Factors with characteristic peaks and topographies • Allows anatomical interpretations of regional findings that are impossible with conventional EEG measures Conclusions 6 Amplitude Spectrum Pz Pz Absolute Amplitude [uV] Cz Cz Fz Fz 3 Fpz Fpz 0 0 7.8 15.6 23.4 31.2 39.0 46.8 54.6 62.4 70.2 78. Freq [Hz] Freq [Hz] Frequency [Hz] • Amplitude spectra of CSD from resting EEG: • Clarify and separate key features of the resting EEG, including: • (1)Alpha peak that is largest at posterior sites (eyes closed) • (2)Low frequency EOG artifacts, largest near eyes (eyes closed) • (3)EMG artifacts largest near face (e.g., Fp1/2, eyes open) • (4) Electrical artifacts at 60 and 70 Hz (at Fz) • Waveform Comparison: • CSD Alpha peak at inferior sites (P8) has a lower peak frequency and includes more theta (4-8 Hz) than the midline (Pz) alpha peak • Alpha is also seen at Fz (eyes closed), and is partially separable from a lower frequency peak Overview of Amplitude Spectra of CSD -2 0 • Factors derived from dataset • PCA uses a linear statistical model to produce orthogonal components • Factors are useful for identifying and defining temporal measures [Amplitude Map at 10 Hz] Properties of PCA +3 EEG Time Series: A single cosine wave topography that varies linearly across the midline sites (Fpz, Fz, Cz, Pz), shown for a Fpz and Cz reference. Fourier Transformation: Fourier spectra are linearly and reversibly related to the temporal data. Since the simulated data are simple cosines, the complex spectra consist of real numbers. Color maps show spherical spline interpolations for a 12-channel EEG montage with lateral activity identical to midline sites. Amplitude Spectrum: Amplitude of Fourier Spectra (i.e., amplitude of frequency spectrum via Pythagorean Theorem). The amplitude spectrum is identical to the Fourier spectrum when and only when components are real and positive (FPz reference), but differs markedly when they are not (Cz reference). • Fourier Spectra are complex, with both amplitude (Pythagorean Theorem) and phase (angle from real axis) • Power Spectra simplify EEG variance, integrating squared amplitudes over frequency (i.e., Mean Squared) • Power Spectra have empirical and theoretical value independent of the EEG applications (e.g., random process models, systems theory, etc.) Properties of EEG Power Spectra References Bendat, J.S., and Piersol, A.G. Random Data: Analysis and measurement procedures. Wiley-Interscience, New York, 1971. Goncharova, I.I., McFarland, D.J., Vaughan, T.M., and Wolpaw, J.R. EMG contamination of EEG: spectral and topographic characteristics. Clin. Neurophysiol., 2003, 114, 1580-1593. Kayser, J., Tenke, C.E. Optimizing PCA methodology for ERP component identification and measurement: Theoretical rationale and empirical evaluation. Clin. Neurophysiol., in press. Kayser, J., Tenke, C.E., Debener, S. Principal components analysis (PCA) as a tool for identifying EEG frequency bands: I. Methodological considerations and preliminary findings. Psychophysiology, 2000, 37, S54. Pizzagalli, D.A., Nitschke, J.B., Oakes, T.R., Hendrick, A.M., Horras, K.A., Larson, C.L., Abercrombie, H.C., Schaefer, S.M., Koger, J.V., Benca, R.M., Pascual-Marqui, R.D., and Davidson, R.J. Brain electrical tomography in depression: the importance of symptom severity, anxiety, and melancholic features. Biol Psychiatry, 2002, 52, 73-85. Perrin, F., Pernier, J., Bertrand, O. and Echallier, J.F. Spherical splines for scalp potential and current source density mapping. Electroencephalog. clin. Neurophysiol., 1989, 72, 184-187. Pivik R.T., Broughton R.J., Coppola R., Davidson R.J., Fox, N., and Nuwer, M.R.. Guidelines for the recording and quantitative analysis of electroencephalographic activity in research contexts. Psychophysiology, 1993, 30,547-58. Nunez, P.L. Electric Fields of the Brain: The neurophysics of EEG, New York: Oxford, 1981. Tenke,C.E. Statistical characterization of the EEG: the use of the power spectrum as a measure of ergodicity. Electroencephalog. Clin. Neurophysiol., 1986, 63, 488-493. Tenke,C.E., Schroeder, C.E., Arezzo, J.C. and Vaughan, H.G., Jr. Interpretation of high- resolution current source density profiles: a simulation of sublaminar contributions to the visual evoked potential. Exp. Brain Res., 1993, 94,183-192. Electrophysiologic measures may provide useful information about the anatomical origin and physiological significance of an experi-mental finding. However, certain methodological choices severely limit the capacity for such inferences. Notable issues concern the impact of the (1)recording reference and the (2)quantification method itself (i.e., defining and measuring a component or frequency band). (1) The reference problem has been addressed by the parallel application of different reference schemes. As an alternative, CSD methods (Laplacian, Hjorth, etc.) can be used as a true reference-free measure with a known correspondence to neuronal current generators. (2) The quantification problem has been addressed by defining multiple, more loosely defined frequency bands tailored to the data. These problems are exacerbated in quantitative EEG studies that apply nonlinear transformations to the data (e.g., logarithmic transformations, power or amplitude spectra, and asymmetry measures derived from them). We now describe a general, reference-free, data-driven method for simplifying and quantifying EEG CSD spectra using frequency PCA. Impact of Reference on Spectral Topographies of Field Potential and CSD Introduction Field Potential Topographies CSD Topographies Reference Electrode Fpz Cz Fpz Cz Fourier Maps (data w/o asymmetry) Linear midline gradient Lateral = midline Fourier Maps (asymmetric data) Linear midline gradient Asymmetry added to mid-frontal sites: F3 = F3 - .5 µV F4 = F4 + .5 µV Irreversible nonlinear Transformation Amplitude Maps (asymmetric data) Fourier Maps (data w/o asymmetry): While field potentials of Fourier maps shift in amplitude and sign depending on the chosen reference, both produce identical CSD maps (approximately zero due to the linear gradient). Fourier Maps (asymmetric data):When a hemispheric asymmetry is added to mid-frontal sites (left < right), it is evident in the field potential Fourier maps for both reference schemes. The “frontal generators” of the asymmetry are evident from the CSD maps. Amplitude Maps (asymmetric data): Nonlinear transformations commonly used in spectral analysis (power or absolute value) may distort a field topography and even reverse the direction of an asymmetry. In contrast, the equivalent transformation of CSD data preserves all information about the location of current generators without distortion. Only phase information related to concurrent source/sink properties is lost. Topographies of first nine fPCA Factor Scores (96.14% variance of Amplitude Spectra) High Variance (88.59% total) +.6 EMG Artifact High Alpha EOG Artifact Low Alpha Alpha Factors 6-9 (additional 7.55%) -.6 High Beta 60 Hz Low Beta Alpha Residual • First five factors accounted for almost 90% of the variance of the CSD Amplitude Spectra; Alpha activity was represented by Factors 1, 3 and 5 • Factors 2 and 4 extracted known physiological artifacts (EMG, EOG) • Factors 6-9 each accounted for less than 2% of the variance (60.16 Hz: 1.98%; low beta: 17.97 Hz, 1.94%; 8.59 Hz, 1.92%; high beta: 23.44 Hz) Overview of fPCA solution Single Epoch for Representative High Fz Subject Black = Fz Red = P8 200 800 1000 1200 0 400 600 0.0 +0.4 Amplitude Spectrum of CSD Epoch [Hz] 6.2 7.0 7.8 8.6 9.4 10.1 11.0 Lowpass filtered (15 Hz) CSD waveforms at Fz (black line) and P8 (red) from a representative epoch in a subject with high factor scores for Factor 1. Waveform peaks at Fz and P8 show current sources (warm colors) alternating with sinks (cold colors) between the two sites. The topography of the Amplitude Spectrum of this epoch reflects both midline frontal and posterior/inferior foci described by Factor 1. A single generator (or pair) is unlikely, since CSDs of dipolar ERP generators are less focal at a distance (e.g., N1).