Download

1 / 18
180 likes | 205 Views
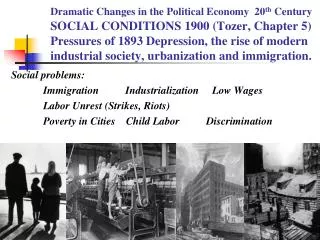
This research examines the effects of immigration, minimum wages, and discrimination on the labor market. It analyzes the impact of a large influx of Cuban immigrants on wages and employment in Miami, the relationship between minimum wage increases and employment in the fast-food industry, and the presence of discrimination in orchestra auditions.

E N D
Panel Data Research:Immigration, Minimum Wages, and Discrimination
I. Immigration Card, David. “The Impact of the Mariel Boatlift on the Miami Labor Market.” Industrial and Labor Relations Review, 43(2); Jan. 1990. 245-57. Question: How did a large influx of Cuban immigrants into the Miami labor market affect the wages and employment of low-skilled Miami natives? OR: Is the labor demand-curve downward sloping? Natural experiment: In April 1980, Castro declared that Cubans wishing to immigrate to the U.S. were free to leave. As a result, ~125,000 mostly poor, low-education, non-English-speaking Cubans arrived in Miami in about a year. Card compares what happened to wages of low-skilled Miami natives to wages of similar workers in similar cities.
I. Immigration Strategy: Differences-in-Differences Treatment: Mariels’ arrival in Miami Control: Atlanta, Houston, LA, Tampa/St. Pete lwageit = β0 + β1Miamiit + β2Post-Marielit + β3Miami*Postit + uit β1 tells us if wages in Miami were different from the control cities before the boatlift β2 tells us if there was any change in wages for all cities between the pre- and post-Mariel period β3 tells us the effect of the treatment on the treated—whether the boatlift had any impact on the Miami labor market
I. Immigration So labor force increased by 7%, but no effects on wages (or employment). How? Card: --Mariels displaced other immigrants & migrants, natives (So are Tampa, Atlanta good comparison cities?) --Increase in labor demand greater in Miami than control cities Others: --Dif-in-Difs no good here, because experiment has low power (few observations, few time periods). Boatlift that didn’t happen? --No clustering! Even if we believe the results, would we expect other cities to have similar responses to immigration? Or is Miami especially able to absorb this kind of shock?
II. Minimum Wages Card, David and Alan Krueger. “Minimum Wages and Employment: A Case Study of the Fast-Food Industry in New Jersey and Pennsylvania.” The American Economic Review, 84(4); Sep. 1994. 772-93. Also a natural experiment using dif-in-dif. New Jersey increases minimum wage from $4.25 to $5.05 per hour in 1992. Compare employment and wages in New Jersey and Pennsylvania, before and after the law. empi = β0 + β1NJit + β2Post-lawit + β3NJ*Postit + uit
II. Minimum Wages So, it appears that employment actually increases with a minimum wage increase! Explanations --Standard model of MW in competitive labor market is wrong --Not enough time for law to take effect. With longer time horizon, other researchers have found disemployment effects --FTE is not a good measure of employment --Possible that some restaurants were affected (small businesses, or new restaurants didn’t open)
II. Minimum Wages Neumark, David and William Wascher. “Employment Effects of Minimum and Subminimum Wages: Panel Data on State Minimum Wage Laws.” Industrial and Labor Relations Review, 46(1); Oct. 1992. 55-81. Have panel data on state minimum wages and local economic conditions, 1977-1989. Eit is employment, Yt are year dummies and the Si are state fixed-effects.
II. Minimum Wages Laws may still be endogenous (states enact laws when economy is good), so Neumark & Wascher use minimum wage in bordering states as instrument for state’s minimum wage. Find similar results. Also do first-differences: regress change in employment on change in minimum wage, for one-year and eight-year gaps: Eit – Eit-1 = δ0 + β1(MWit - MWit-1) + β2(Xit - Xit-1) + (eit – eit-1)
II. Minimum Wages This shows that short time periods may not be long enough to observe effects of minimum wage (relevant for Card & Krueger’s results). Results: A 10% increase in minimum wage appears to be associated with a 1% to 2% decrease in employment of teenagers, and a 2% decrease in employment of young adults.
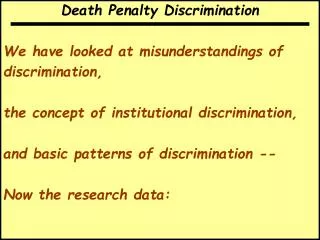
III. Discrimination Are employers less likely to hire women, all else equal? The case of orchestras: “women have smaller techniques than men,” “are more temperamental and more likely to demand special attention or treatment,” and “the more women, the poorer the sound.” Zubin Mehta, conductor of LA Symphony and New York Philharmonic, 1964-1990: “I just don’t think women should be in an orchestra.” Issue: just because we observe fewer women, doesn’t mean there is discrimination. It could be that women are less musically talented than men, on average.
III. Discrimination Solution: Natural experiment Many orchestras in the ’70s and ’80s began using screens when auditioning musicians, to create ‘blind’ auditions. If there is discrimination against women, when auditions are blind (so that the evaluator knows nothing about the musician other than how the music sounds), more women should be hired into orchestras.
III. Discrimination It looks like women actually do worse in blind auditions than in not-blind auditions! Why might this be? Selection Solution: Use individual fixed effects. Then, the question becomes, “does the same woman have a better chance of being hired when the audition is blind?”
III. Discrimination Even columns include year dummies and other controls for individual and orchestra characteristics. Coefficient on Blind tells us the effect of blind auditions on men’s probability of being hired, no significant effects. Coefficient on Female x Blind tells us whether the effect of blind auditions is different for women. Positive and statistically significant effect, except for semifinals (may be affirmative action in non-screen auditions).
IV. Conclusion Natural experiments allow economists to test theories in a real-world setting. Differences-in-differences, first differences, and fixed effects are powerful tools for evaluating the results of natural experiments. Each technique requires pooled cross sections or panel data. Policy implications—different econometric techniques can yield very different results!