Download

1 / 4
40 likes | 157 Views
KEY CONCEPT Pyramids model the distribution of energy and matter in an ecosystem. energy lost. energy transferred. An energy pyramid shows the distribution of energy among trophic levels. Energy pyramids compare energy used by producers and other organisms on trophic levels.

E N D
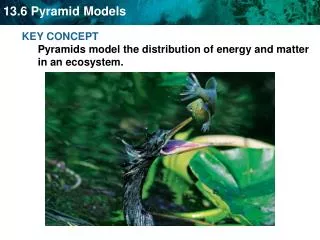
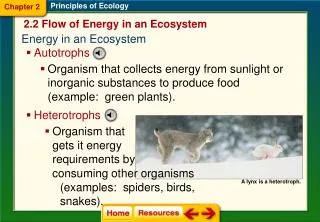
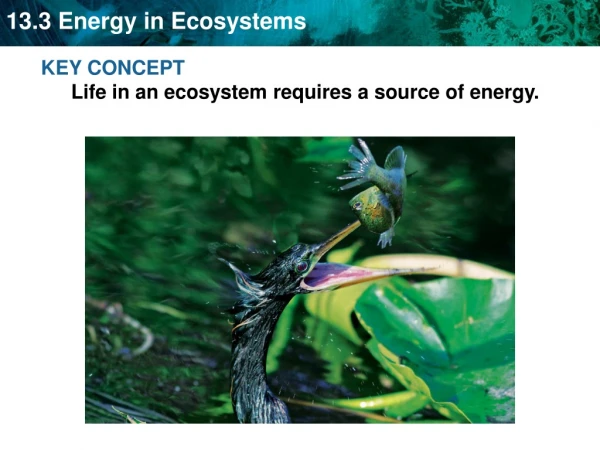
KEY CONCEPT Pyramids model the distribution of energy and matter in an ecosystem.
energy lost energy transferred An energy pyramid shows the distribution of energy among trophic levels. • Energy pyramids compare energy used by producers and other organisms on trophic levels. • Between each tier of an energy pyramid, up to 90 percent of the energy is lost into the atmosphere as heat. • Only 10 percent of the energy at each tier is transferred from one trophic level to the next.
tertiary consumers 75 g/m2 150g/m2 secondary consumers primary consumers 675g/m2 2000g/m2 2000g/m2 producers producers Other pyramid models illustrate an ecosystem’s biomass and distribution of organisms. • Biomass is a measure of the total dry mass of organisms in a given area.
5 tertiary consumers secondary consumers 5000 primary consumers 500,000 producers 5,000,000 producers 5,000,000 • A pyramid of numbers shows the numbers of individual organisms at each trophic level in an ecosystem. • A vast number of producers are required to support even a few top level consumers.