Forecasting Techniques with Regression Models in Economics
390 likes | 417 Views
Learn about single equation regressions and their applications in economic forecasting using OLS techniques, interpreting results, generating forecasts, and evaluating accuracy with ex-post and ex-ante methods.

Forecasting Techniques with Regression Models in Economics
E N D
Presentation Transcript
Forecasting Techniques: Single Equation Regressions Su, Chapter 10, section III
Regression Models • Represent functional relationships between economic variables • Usually estimated by OLS techniques • General Form Yt = b0 + b1X1t + b2X2t + … + bkX1k + ut Yt : Dependent Variable Xit‘s : Explanitory Variables bi‘s: Parameters ut : Stochastic Term
Regression: Forecasting Ability • Depends on the structure of the regression equation, including • Degrees of Freedom: Should be > 30 • Statistical Significance and sign of parameters • High Goodness of Fit • Low Standard Error of Estimate • High R2
Forecasting with Regression Models • Depends on choice of X’s, which is generally guided by economic theory • Example: According to the IS/LM model, what variables would be useful for forecasting GDP? • Generally speaking, more data should be preferred
Some Useful Concepts I • Ex Post Forecast: Extrapolation goes beyond sample period but not into future • Example: Sample period for regression is 1970-1997, forecast through 2000 • Ex Ante Forecast: Extrapolation extends into future • Example: Sample period is 1990:1-2001:1, forecast through 2002:1
Some Useful Concepts II • Predictive power of a regression model depends on its lag structure • Conditional Forecasts: Some contemporaneous explanatory variables appear on RHS • Must also predict values for these contemporaneous explanatory variables • Unconditional Forecasts: Only lagged explanatory variables appear on RHS
Some Useful Concepts III • Point Forecast: Predicts a single number • Example: The Dow will be 1100 on July 1 • Interval Forecast: Shows a numerical interval in which the actual value can be expected to fall • Example: The Dow will be between 1000 and 2000 on July 1 with 99% probability
Example: Automobile Sales • Want to replicate the regression results in section 4 • Use the regression data analysis tool to replicate the results on page 348 • Model: Yt = a + bXt + ut • Y: Automobile Sales X: New Car Price • Linear Demand Curve
Procedure • Step 1: Copy the sales and price data to a new worksheet • Step 2: Start the regression data analysis tool • Specify correct ranges
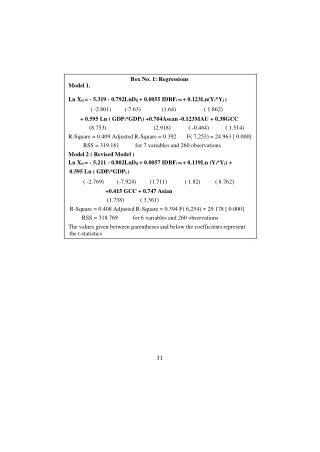
Interpreting Regression Results • Yt = 10,200.23 - 30.275Xt (10.20) • Parameter on X: -30.27 • t-statistic: 3.08
Ex Post Point Forecasts • To make an ex post forecast for 1991, simply plug the actual value of the price index for 1991 into (10.20) - Put in D22 • Yt = 10,200.23 - 30.275(125.3) = 6,406.77 • Note that ex post forecasts can be done for any year in the period for which data are available
Evaluation of Ex Post Forecasts • Can also evaluate forecasts within sample • Copy the formula from D22 into D21 • Where in the regression output can you find this number? • Fill in the rest of column D with the Ex Post Forecasts and plot the actual sales and the Ex Post forecasts
Summary Statistics • Already know how to calculate, but in this case the regression function has already done some of the heavy lifting • We saw where the Ex Post forecasts could be found, what about the forecast errors?
Residuals and Forecast Errors • In the terminology of econometrics, ex post forecast errors are called residuals • The OLS estimator is designed to minimize the sum of the residuals squared - OLS estimates minimize MSE and RMSE • To find value of MSE, look on the ANOVA table, for the row labeled Residual and under the column labeled SS
Ex Ante Point Forecasts • To generate these, must forecast X, as these forecasts are conditional on unknown future values (must pretend that the present is 1991 in this case) • How should X be forecast?
Ex Ante Point Forecasts: Example • Step 1: Extend the time column to 1994 • Step 2: Calculate the forecasted X’s using the same change naïve forecasting model in column C • Step 3: Using the formula from above, calculate the Ex Ante forecasts for 1992 - 1994 and chart them
Interval Forecasts • Instead of a line, can also display the range in which the forecast values will probably fall • These are called interval forecasts and are based on the variance of the regression • Based on (10.18)
Interval Forecasts: Example • Must calculate average of X and sum of X - average(X) = x • First term of (10.18) is just ex ante forecast • t0.025 is just a value from a table in a statistics book • se has already been calculated by the regression program • Text has wrong numbers
Autoregressive Models • Even though they use sophisticated statistical techniques, these models are extrapolations • The explanatory variables (X’s) are lagged values of the dependent variable • Assumes that the time path of a variable is self-generating • Also called the “Chain Principle”
AR Models: Functional Forms • General: Xt = f(Xt-1,Xt-2,Xt-3,...,b1, b2,, b3...,ut) • ut : residual term, captures random components • Must specify form and lag length • Linear form, lag length k Xt = b0 + b1 Xt-1,+ b2Xt-2,+ …+ bkXt-k + ut Note that both No Change and Same Change naïve forecasts are special cases of this
AR Models: Determining Lag Length • The general form has an infinite number of parameters, but we never have this much data - model must be restricted to be used • Assume that the impact of some distant Xt-j are trivial and insignificant • Rule of thumb: don’t use a k >4 because of econometric problems
Dummy Variables • Requires no additional economic data • Was discussed in chapter 2 • Two Types: • Trend • Seasonal / annual
Dummy Variables: Trends • Uses a time variable T (=1,2,3,…) and extrapolates X along its time path Linear: Xt = a + bTt Exponential: X = ea + bTt Reciprocal: X = 1/[a + bTt] Parabolic: X = b0 + b1 Tt,+ b2T2t
Dummy Variables: Seasonal • These are “Intercept shifters” - they allow the intercept term b0 to vary systematically • Single Equation Model with Quarterly Dummies: Yt = g1Q1+g2Q2+g3Q3+g4Q4+b1X1t+…+bkX1k+ut • Can also use monthly dummies if Y is monthly • Get a different forecast for each quarter
Other Dummy Variables • Dummy variables can be useful tools in forecasting • Recall from the earlier section that the single equation forecast for new car sales was high for 1991 because it was a recessionary year • Can use a dummy variable for recessions to improve this forecast
Example: Recession Dummy • Model: Yt = a + bXt + gDR + ut • Y: Automobile Sales X: New Car Price • DR: Recession Dummy, = 1 in years with troughs • Add new sheet to spreadsheet, copy Year, New Car Sales, New Car Price • Look at Table 7.1, p. 236 to create dummy
Empirical Results Yt = 10,699.87 - 31.66Xt - 1893.29DR (571.918) (6.233) (360.237)
Exercise: AR Models • Data: U.S. Population 1948-1990 • Available in a text file on Web page (tab2-1.txt) • Step 1: Read file into Excel
Exercise: Creating Lag Variables • Best way is with formulas, although could copy as well • Population data are in column 2 • Step 2: Label columns 3-6 “Lag1”, “Lag2”, “Lag3” and “Lag4” • What value goes in C3? D4? E5? F6?
C3 is the Lag1 value for 1949, which is the actual population in 1948 - population lagged one year • D4 is the Lag2 value for 1950, which is the actual population in 1948 - population lagged two years • Step 3:Fill in rest of lags using formulas
Exercise: AR Regressions • Step 4: Replicate the regression results on page 352. Note: Watch sample period • Step 5: Calculate Ex Post forecasts for the sample period and RMSE for each method • Which has the lowest RMSE? • Step 6: Calculate Ex Ante population forecasts through 2025 and compare to Table 10.4
Exercise: Trend Forecasting • Step 1: Create trend and trend squared variables in the spreadsheet • Step 2: Replicate the three regression results shown on page 354 • Step 3: Calculate a 100 year ahead Ex Ante forecast of U.S. population using each, and chart the time paths • How accurate are these forecasts