Download
1 / 26
260 likes | 366 Views
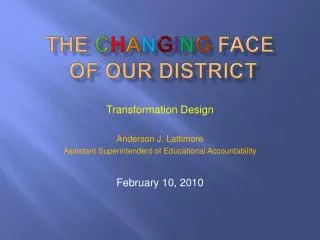
The C h a n g i n g Face of our District. Transformation Design Anderson J. Lattimore Assistant Superintendent of Educational Accountability February 10, 2010. Discussion Context. Transformation Initiatives

E N D
The Changing Face of our District Transformation Design Anderson J. Lattimore Assistant Superintendent of Educational Accountability February 10, 2010
Discussion Context • Transformation Initiatives • Vibrant restructuring of education to reflect a “personalized and blended” learning system to maximize the potential of each student • Embrace and exploit 21st Century expectations and learning standards for our students • Promote the concept that learning takes place anywhere and occurs in a variety of delivery methods • Projection: KUSD for three (3) years into the future • Trend Analysis based upon previous results
Our Changing Demographics 1951 To Present
KUSD – Then and Now KUSD – 1990 KUSD - 2010
The Hispanic, Economically Disadvantaged, and ELL populations are projected to increase. • The Caucasian population is projected to decrease. • The Asian, Hawaiian/Pacific Islander, African American, Native American, and Students with Disabilities population is projected to remain relatively stable. NOTE: Projections based on MS EXCEL Trending Analysis
Changes in Student Demographics NOTE: Projections based on MS EXCEL Trending Analysis
Student Achievement WKCE Results (Reading and Math)
The overall percent of students (ALL) who are proficient/advanced in Reading is projected to remain stable. • WKCE scores are projected to slightly increase. • Scores for ELL students are projected to increase. • SWD and Econ Dis students are still areas of greatest concern NOTE: Projections based on MS EXCEL Trending Analysis
The overall percent of students who are proficient/advanced in Mathematics is projected to increase. • Scores for each disaggregated group are projected to rise each year. NOTE: Projections based on MS EXCEL Trending Analysis
Attendance for Hispanic students is projected to increase at a faster rate when compared to other subgroups. • ELL students are projected to achieve a higher attendance rate than other subgroups. • The elementary overall attendance rate is projected to remain stable. NOTE: Projections based on MS EXCEL Trending Analysis
African American students and Students w/Disabilities are projected to achieve lower attendance rates than other subgroups. • ELL students are projected to achieve a higher attendance rate than other subgroups. • The middle school overall attendance rate is projected to remain fairly stable. NOTE: Projections based on MS EXCEL Trending Analysis
Students w/Disabilities are projected to achieve a significantly lower attendance rate than other subgroups. • Caucasian students are projected to achieve a higher attendance rate than other subgroups. • The high school overall attendance rate is projected to increase even though it is significantly lower than the elementary and middle school rates. NOTE: Projections based on MS EXCEL Trending Analysis
African American Students and Students w/Disabilities are projected to achieve significantly higher OSS rates than other subgroups. • Hispanic and Caucasian students are projected to achieve lower OSS rates than other subgroups. • The elementary overall OSS rate is projected to decrease. NOTE: Projections based on MS EXCEL Trending Analysis
African American Students and Students w/Disabilities are projected to achieve significantly higher OSS rates than other subgroups. • Hispanic and Caucasian students are projected to achieve lower OSS rates than other subgroups. • The middle school overall OSS rate is projected to decrease slightly. NOTE: Projections based on MS EXCEL Trending Analysis
African American Students and Students w/Disabilities are projected to achieve significantly higher OSS rates than other subgroups. • Hispanic and Caucasian students are projected to achieve lower OSS rates than other subgroups. • The high school overall OSS rate is projected to decrease slightly. NOTE: Projections based on MS EXCEL Trending Analysis
African American Students are projected to achieve a truancy rate 2 times greater than Hispanic students and 6 times greater than Caucasian students. • The elementary overall truancy rate is projected to remain stable. NOTE: Projections based on MS EXCEL Trending Analysis
African American Students are projected to achieve a truancy rate 2 times greater than Hispanic students and 4 - 5 times greater than Caucasian students. • The middle school overall truancy rate is projected to increase each year. NOTE: Projections based on MS EXCEL Trending Analysis
The truancy rates for African American students are projected to remain stable; the rates for Hispanic and Caucasian students are projected to increase. • The high school overall truancy rate is projected to increase each year. • High school truancy rates are significantly higher than elementary and middle school rates in each subgroup. NOTE: Projections based on MS EXCEL Trending Analysis
Summary • KUSD demographics have changed • More Diversity • Increasing “Economically Disadvantaged” Rate • Sustained SWD Rate • African American and Hispanic students continue to perform below their Caucasian counterparts (WKCE) • SWD and Economically Disadvantaged continue to perform below their counterparts
Summary (cont’d) • African American and Hispanic students exhibit higher discipline referral rates than their Caucasian counterparts • High School students exhibit a reduced attendance rate when compared to their other cluster counterparts • Middle School OSS rates are higher than their cluster counterparts • Both High School and Middle School clusters exhibit a high habitual truancy rate for “children of color”
Summary (cont’d) African American and Hispanic students exhibit dropout rates much higher than their Caucasian counterparts (Not Shown) KUSD has and will continue to experience phenomenon associated with urban school districts
The new KUSD Transformation Plan must serve as our best collective effort to restructure our district for the 21st Century. We must now begin in earnest to transform ourselves from “good to great”!