Download
1 / 26
260 likes | 296 Views
Learn about utilizing fluorescence detection in DNA separation for forensic DNA profiling using capillary electrophoresis instruments for accurate analysis and interpretation.

E N D
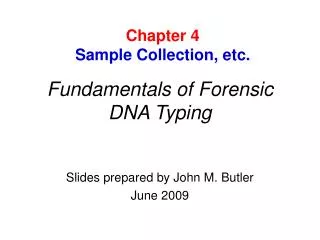
Chapter 9 DNA Separation & Detection Fundamentals of Forensic DNA Typing Slides prepared by John M. Butler June 2009
Chapter 9 – DNA Separations and Fluorescence Detection Chapter Summary • A multiplex PCR amplification of STR markers produces a complex mixture of DNA molecules that must be separated based on DNA size and fluorescent dye label to produce a coherent DNA profile. Original gel electrophoresis separation methods have been almost entirely replaced by capillary electrophoresis (CE) instruments over the past decade due to ease of use and automation. The most commonly used CE systems are the single capillary ABI Prism 310 Genetic Analyzer and the multi-capillary ABI 3100 or 3130xl. These CE instruments electrokinetically inject the negatively charged DNA molecules from a formamide-diluted sample of the PCR products mixed with an internal size standard. The size standard is labeled with a separate fluorescent dye to enable calibration of each analysis so that comparisons can be made between samples run at different times on the same instrument. A polymer solution inside the capillary permits resolution of DNA fragments differing by as little as a single basepair (bp) over a size range of approximately 100 to 400 bp. Fluorescent dyes are present on one strand of each PCR product due to incorporation of a PCR primer during multiplex PCR amplification. These dyes are excited by laser as they pass a detection point in the CE instrument. Since the four or five fluorescent dyes used in STR analysis have different chemical properties, they emit light at slightly different wavelengths enabling detection in different color channels. Because there is overlap with the emitted light from the different dyes, mathematical algorithms are used to perform a “matrix correction” or “spectral calibration” so that individual DNA peaks in an electropherogram appear to be labeled with a single color.
Gel stand Loading well - anode cathode - + Gel Buffer DNA bands + Voltage Gel lanes Side view Top view Gel Electrophoresis System John M. Butler (2009) Fundamentals of Forensic DNA Typing, Figure 9.1
Laser Capillary filled with polymer solution Detection window - + 5-20 kV (cathode) (anode) Outlet Buffer Inlet Buffer Data Acquisition Sample tray Sample tray moves automatically beneath the cathode end of the capillary to deliver each sample in succession Capillary Electrophoresis System John M. Butler (2009) Fundamentals of Forensic DNA Typing, Figure 9.2
Argon ion LASER (488 nm) Size Separation ABI Prism spectrograph Color Separation Fluorescence Sample Separation Capillary (filled with polymer solution) CCD Panel (with virtual filters) Sample Detection Sample Injection Processing with GeneScan/Genotyper software Mixture of dye-labeled PCR products from multiplex PCR reaction Sample Preparation Sample Interpretation John M. Butler (2009) Fundamentals of Forensic DNA Typing, Figure 9.3
(a) Larger DNA molecules interact more frequently with the gel and are thus retarded in their migration through the gel Gel (b) Gel Long DNA molecules Small DNA molecules Ogston Sieving Reptation DNA Separation Modes John M. Butler (2009) Fundamentals of Forensic DNA Typing, Figure 9.4
(a) S’1 2 S1 energy 1 hex hem 3 So (b) Emission Excitation Stokes shift 1 3 Fluorescence ex max em max Wavelength (nm) Fluorescence and Excitation/Emission Spectra John M. Butler (2009) Fundamentals of Forensic DNA Typing, Figure 9.5
Unlabeled DNA Intercalator inserts between base pairs on double-stranded DNA Ethidium bromide SYBR Green DNA labeled with intercalating dye One strand of PCR product is labeled with fluorescent dye Fluorescent dye labeled primer (a) (b) Fluorescent dNTPs are incorporated into both strands of PCR product John M. Butler (2009) Fundamentals of Forensic DNA Typing, Figure 9.6 (c)
JOE (green) FAM (blue) TAMRA (yellow) ROX (red) John M. Butler (2009) Fundamentals of Forensic DNA Typing, Figure 9.7
5-FAM JOE NED ROX 100 80 60 Normalized Fluorescent Intensity 40 20 0 600 520 540 560 580 620 640 WAVELENGTH (nm) 310 Filter Set F with color contributions Laser excitation (488 nm, 514.5 nm) John M. Butler (2009) Fundamentals of Forensic DNA Typing, Figure 9.8
DNA size in base pairs Relative Fluorescence Units (a) Scan number Region shown below Relative Fluorescence Units John M. Butler (2009) Fundamentals of Forensic DNA Typing, Figure 9.9 (b)
Capillary Detection window Heat plate Syringe (with polymer) Gel block electrode Samples Outlet buffer reservoir Sample tray Inlet buffer reservoir Autosampler John M. Butler (2009) Fundamentals of Forensic DNA Typing, Figure 9.10
Mechanical pump (with polymer) Detection window Capillary array Oven Fan Lower gel block electrodes Polymer bottle Outlet buffer reservoir Sample tray Autosampler Inlet buffer reservoir John M. Butler (2009) Fundamentals of Forensic DNA Typing, Figure 9.11
Capillaries John M. Butler (2009) Fundamentals of Forensic DNA Typing, Figure 9.12 Electrodes for Injection
8 repeats Locus 1 10 repeats 8 repeats Locus 2 9 repeats Scanned Gel Image Capillary Electropherogram The polymerase chain reaction (PCR) is used to amplify STR regions and label the amplicons with fluorescent dyes using locus-specific primers
Transfer of DNA Samples • Following PCR, a small portion of the sample is transferred for analysis • This aliquot of the sample is mixed with a molecular size marker (termed an internal size standard) that permits calibration of sizing measurements
Sample Plates Spun Down via a Centrifuge • Sample plates are spun to remove bubbles that would interfere with the injection (loading) process onto the capillary electrophoresis instrument
ABI 3130xl DNA Analysis Instrument • Import sample names • Determine run conditions (voltages and times to be used based on laboratory protocols)
DNA Profile Data Collection on ABI 3130xl Instrument • Data analysis is performed on an Applied Biosystems (ABI) 3130xl capillary electrophoresis instrument
Capillary Electrophoresis Instrumentation ABI 310 single capillary ABI 3100 16-capillary array
A DNA Profile is Produced by Separating DNA Molecules by Size and Dye Color LASER Excitation(488 nm) The labeled fragments are separated (based on size) and detected on a gel or capillary electrophoresis instrument ~2 hours or less Fragment size ranges from 100 - 350 base pairs Peaks represent labeled DNA fragments separated by electrophoresis This ‘profile of peaks’ is unique for an individual – a DNA type
ABI 310 Data Before and After Matrix is Applied Source: AFDIL training slides
Profiler Plus multiplex STR result DNA size (bp) D8S1179 D21S11 D5S818 D3S1358 D7S820 FGA D18S51 Amel D13S317 VWA COfiler multiplex STR result DNA size (bp) D3S1358 TH01 D7S820 TPOX Amel CSF1PO D16S539
Mechanical stepper motor Heated plate for temperature control Syringe filled with POP-4 polymer Detection window Injection electrode Pump Block sample tubes Buffer (outlet) Autosampler Tray capillary Buffer (inlet) Deionized water
Replace capillary Performed only once per batch of ~96 samples Refill syringe with polymer solution Fill buffer vials Prepare samples (denature, cool, and mix with size standard) Prepare sample sheet and injection list Allelic ladder every tenth injection Automated Sample Injection, Electrophoresis and Data Collection Size DNA Fragments GeneScan Software Genotype STR alleles Genotyper Software Manually inspect the data ELECTROPHORESIS and DETECTION steps are simultaneous Perform Data Analysis
Chapter 9 – Points for Discussion • What is electro-osmotic flow and how does it impact DNA separations in a capillary? • What component of a PCR reaction is labeled with a fluorescent dye to enable detection of amplified STR alleles?