Download
1 / 19
190 likes | 395 Views
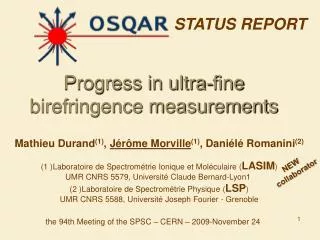
Progress in ultra-fine birefringence measurements. STATUS REPORT. Mathieu Durand (1) , Jérôme Morville (1) , Daniélé Romanini (2) (1 ) Laboratoire de Spectrométrie Ionique et Moléculaire ( LASIM ) UMR CNRS 5579, Université Claude Bernard-Lyon1

E N D
Progress in ultra-fine birefringence measurements STATUS REPORT Mathieu Durand(1), JérômeMorville(1), DaniéléRomanini(2) (1 )Laboratoire de SpectrométrieIonique et Moléculaire (LASIM) UMR CNRS 5579, Université Claude Bernard-Lyon1 (2 )Laboratoire de Spectrométrie Physique (LSP) UMR CNRS 5588, Université Joseph Fourier - Grenoble NEW collaborator the 94th Meeting of the SPSC – CERN – 2009-November 24
The OSQAR Collaboration at present ►24 Membersfrom10 Institutes (Cz, Fr, Po & CERN) CERN, Geneva, Switzerland P. Pugnat (now at LNCMI-CNRS), M. Schott, A. Siemko Charles University, Faculty of Mathematics & Physics, Prague, Czech Republic M. Finger Jr., M. Finger Czech Technical University, Faculty of Mechanical Engineering, Prague, Czech RepublicJ. Hošek,M. Kràl,J. Zicha, M. Virius ISI, ASCR, Brno, Czech Republic A. Srnka IMEP/LAHC - INPG, 38016 Grenoble Cédex-1, FranceL. Duvillaret, G. Vitrant, J.M. Duchamp IN, CNRS – UJF & INPG, BP 166, 38042 Grenoble Cédex-9, France B. Barbara, R. Ballou, Y. Souche • LASIM , UCB Lyon1 & CNRS, 69622 Villeurbannes, France • M. Durand, J. Morville LSP, UJF & CNRS, 38402 Saint-Martin d'Hères, FranceR. Jost,S. Kassi,D. Romanini TUL, Czech Republic M. Šulc Warsaw University, Physics Department, Poland A. Hryczuk,K. A. Meissner The OSQAR Experiments at CERN to probe QD & Astroparticle Physics from the Photon Interaction with a Magnetic Field
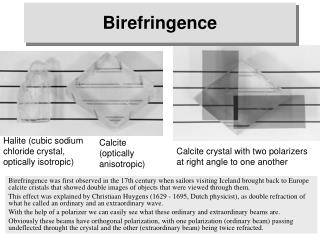
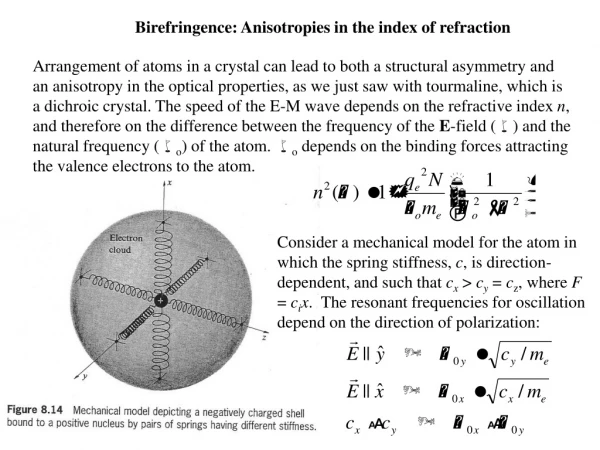
What is birefringence ? Matter anisotropy induces different answer with the electric field vector orientation Light exits elliptically polarized Entering linearly polarized Malus law for small dephasing
The vacuum embedded in a magnetic field should also be anisotropic If giving Is predicted @ l=500 nm with the CERN dipole magnets
Using High Finesse Optical Cavity The medium is contained between two high reflective and low losses dielectric mirrors R~99,999% R+T+Loss=1 (Loss~fewppm) If light resonates inside the cavity (constructive interference at each round trip), Light transmitted trough the exit mirror has an effective optical pathlength of with the finesse
Recent Kerr anisotropy measurements PhD thesis : Mathieu Durand (07/23/2009) Voltage Dn=K.E2 Gas Polarizer Crossed Polarizer At this level of sensitivity, residual mirrors birefringence entirely conceals the effect of gas birefringence
Using residual mirrors birefringence as an optical bias for homodyne detection qout z qM y x x qin fout fM(fin,fout,qin,qout) fin Modulated Voltage W Crossed polarizer Polarizer
DC W component negligible high order terms The lowest gas dephasing measurable : Sensitivity given by : Gain induced by the optical bias :
Experimental set-up with N2 as a gas test IT Diode LASER Polarizer l/4 Modulated voltage W Lock’indetectionatW IT trd=147 ms F =277 000 (L=50 cm) [V] I┴ E=6,4 V/mm [mV] Time (µs) E=0 V/mm I┴ W Time (sec)
Measured sensitivity with N2 as a gas test 0 V/mm 1,3 V/mm 6,4 V/mm 2,7 V/mm [10-12 rad] sfg Dfg • sfg = 4.10 -12 rad/Hz1/2
Measured sensitivity with N2 as a gas test as a function of integration time Allan variance plot : 4 9,3 V/mm 0,3 • sfg = 3.10 -13 rad
Measurement of Kerr constants L = 50 cm -Kerr constant K: l = 810 nm KN2 = 1,438.10-25 ± 0,006 m2/V2
Kerr constants of several gases • Molecular gases alignment • Atomic gases distortion of electronic wavefunction 20% 80% 1,64 ± 0,04
Comparison with published results CO2 O2 N2 Ar Ne · He This work (1997) (1967) (1985) (2000) (2005) (2008)
Achievement a table top optical system for Kerr birefringence measurement in gas phase is demonstrated a factor two above the shot noise level with 3 mWincident laser power • sfg = 4.10 -12 rad/Hz1/2 • sfg = 3.10 -13 rad By averaging over 800 s, limited by the laser-cavity servo-lock system Only the PVLAS system reaches comparable performance, based on noise analysis (4-times better, in development since 1994) Our result constitutes the present state-of-the-art validated on a physical signal.
outlooks Accommodation to the OSQAR experiment Recall : With B0=9,5T and L=15m Detection at the shot noise level Measuring in transmission (instead of reflection) : An increase of the laser beam transverse dimension (a factor 40 with a confocal cavity of 20 m length) increases the maximal incident power and thus the shot noise level Integration time of 1 hour : All taken into account
outlooks Magnetic field and homodyne detection scheme qout B y x qin fout fin All the setup rotates 8 Hz demonstrated with the new version Two possibilities Only mirrors rotates around their optical axis maintaining high finesse properties
The cavity more in detailed R~99,999% R+T+Loss=1 (Loss~fewppm) Spectral transmission Dn=c/2L Dn<1kHz n nn-1 nn nn+1 nresonance Constructive interferences => frequency comb The finesse is defined as : Cavity lifetime 18
Mirror birefringence as optical bias and noise analysis Optical detection Laser-cavity locking residual instability • Optimum : • fM ~ 0,1·p/F 19