Download
1 / 44
470 likes | 640 Views
What is Asset Management. Transportation Asset Management. Changing the Paradigm for Transportation Decision Making. Transportation Asset Management?.

E N D
What is Asset Management Transportation Asset Management Changing the Paradigm for Transportation Decision Making
Transportation Asset Management? “An ongoing process of maintaining, upgrading, and operating physical assets cost effectively, based on a continuous physical inventory and condition assessment” Source: Act 499 of the Public Acts of 2002.
How Can TAM Help You? Reduce Long Term Costs $$$ Improve Service More Credibility More Cost Effective More Accountability Communication: Elected Officials Public Justify More Resources!!
National LevelSAFETEA-LU National Commission 1. Rebuilding America: A National Asset Management Program
Why Asset Management? “ We pay for good roads if we have them or not ” 1941 Federal Bureau of Public Roads
The agency level . . .Where the “rubber” meets the road Keep the Good Roads Good Applying The Right Fix In the Right Place At the Right Time
Transition Project Management Systems Management Project Level Vs. Network Level Project: Moving pieces Network: Winning game
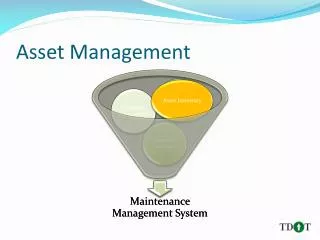
Asset Management Components Inventory What You Own Assess It’s Condition Estimate Future Condition Measure Performance
Inventory — Its Your Foundation What do you own? How much do you own? Where is it?
What Condition Is It In? Condition data will enable you to . . . Identify needs Monitor trends over time Anticipate and plan work Assess funding needs Communicate elected officials public Effective investments
RatingAn “Ordered State” of Condition Block Cracking Moderate Progression Rutting Less Than ½ Inch Transverse Cracks 20 ft. Spacing PASER5 Longitudinal Joint Cracks Present
PASER (Rating)Pavement Condition Rating That Makes Sense Visual survey Based on sound engineering principles Reported on a scale of 1-10 Beauty of it— Explain to Elected Officials Explain to Constituents
IndexSeverity of Individual Distresses 120 sq.ft. minor Rutting 10 pts 270 sq.ft. Moderate Block Cracking 20 pts PCI 45 120 L.F. Med Severity Joint Distress 5 pts 578 L.F. of Severe Transverse Cracks 10 pts
Physical MeasurementAutomated • Measurements of physical aspects • Rutting • Roughness • Skid resistance • Crack frequency • FWD data (pavement rigidity)
Criteria for a Condition Assessment? What is the Cost to Collect? Is it Sustainable? Your Staff? Hire Out? Aid in Decision Making? Can YOU Explain It? To your Boss? To your Crew? To Elected Officials? To the Public?
Key Pavement Management Definitions CDP - Critical Distress Point The CDP is the point when pavement distress changes from needing preventive maintenance to needing structural improvement. (PASER rating 4) RSL - Remaining Service Life RSL is the time in years from the present until the pavement reaches the CDP. ESL – Extended Service Life ESL is the time in years added to the current RSL based on the type of treatment applied. It does not represent the longevity of the treatment.
Pavement Deterioration Terms Today CDP RSL 10 yr. 10 9 8 7 6 PASER RATING 5 4 3 21 1 30 1 5 10 15 20 25 Years Since Construction
Window of Opportunity CDP 10 Routine Maintenance 9 8 7 Window of Opportunity Light & Heavy Maintenance $ Light Rehab $$ 6 PASER RATING 5 4 3 21 Reconstruct $$$$$ 1 30 1 5 10 15 20 25 Years Since Construction
Rehabilitation at 14 YearsCost $150,000 “worst first approach” Crush and Shape At Year 14 10 9 8 7 6 PASER RATING 5 4 CDP 3 ESL 11 yr. 21 1 30 1 5 10 15 20 25 Years
Sealcoat at 10, Overlay at 18 Cost $120,000 Sealcoat at Year 10 10 Overlay at Year 18 9 8 7 6 PASER RATING 5 4 CDP ESL 8 yr. ESL 12 yr. 3 21 1 30 1 5 10 15 20 25 Years
Where is the “Bang for the Buck” ? Example 1 30years 1 Rehab Cost $150,000 Condition Below CDP Example 2 • 30 years • Sealcoat & Overlay • Cost $120,000 • Condition • Above CDP The Winner
System Preservation MUST Be the Priority “Keep the Good Roads Good”
Mix of Fixes… Applying The Right Fix … In the Right Place … At the Right Time
Reconstruct, Reconstruct, ReconstructIs Over—No more Worst First
Service Cycle EXAMPLE 500 lane-mile road network You do 10 lane miles of work each year 500 mi / 10 per yr = 50 years to touch the entire network But! Your asphalt pavement only last 15 years Shows you are doing the wrong thing
Where is the network going? 35 30 25 20 Lane Miles 15 10 5 0 1 2 3 4 5 6 7 8 9 10 More Miles in Poor More Miles in Poor More Miles in Poor Fewer in Good and Fair Fewer in Good and Fair Fewer Miles in Good and Fair PASER Ratings 2004 2007
Management Systems Managing Pavements Isn’t Rocket Science Its Harder ! ! !
Pavement Management In Michigan 280 County Road Commissions Cities Villages 2 Tribes Pavement Culverts Signs Guardrails Pavement Markings Sidewalks Driveways Crashes
Telling your story Average RSL 4 3 2 1 0 -1 Do Nothing -2 -3 -4 0 1 2 3 4 5 Year Source: Michigan Tech Transportation Institute.
Telling your story Average RSL 4 3 2 1 Our Current Strategy (worst first) 0 -1 Do Nothing -2 -3 -4 0 1 2 3 4 5 Year Source: Michigan Tech Transportation Institute. 37
Telling your story Average RSL 4 3 2 Basic Mix of Fixes 1 Our Current Strategy (worst first) 0 -1 Do Nothing -2 -3 -4 0 1 2 3 4 5 Year Source: Michigan Tech Transportation Institute.
Telling your story Average RSL Funding Increase & Mix of Fixes 4 3 2 Basic Mix of Fixes 1 Our Current Strategy (worst first) 0 -1 Do Nothing -2 -3 -4 0 1 2 3 4 5 Year Source: Michigan Tech Transportation Institute.
What a Pavement Management System CAN DO for You Store inventory and condition data Summarize current condition of roadway network Estimate future condition of the roadway network Propose candidate projects Optimize alternative repair and funding strategies Promote communication with your agency Promote communication with the public 40
What a Pavement Management System CANNOT DO for You Sell itself to public and elected officials Replace engineering judgment Substitute for proper maintenance Make decisions for you Provide all the answers
Satisfying Needs . . . Makes It Work Tribal Councils Regional Planning Organizations IRRPCC BIA / FHWA Federal Lands Congress Counties, Cities & Villages Regional Planning Organizations Transportation Asset Management Council State Transportation Commission State Legislature
At the End of the Day . . . . . . Asset Management Is Confirming . . . To yourself, that you are doing the Right Thing. To others, that you are doing the Right Thing.
Why Asset Management ? When times are worst . . . . . . You need it the most!