Fit Region
Fit Region. [-0.1,0.2] GeV 2 are chosen Fits ending at 0.2, 0.38, 0.5 are studied. I found fit in [-0.1, 0.2] region gives the largest significance for ; because More BG appear in higher region Cannot trust MC for other decays in higher region. Comparison (1).

Fit Region
E N D
Presentation Transcript
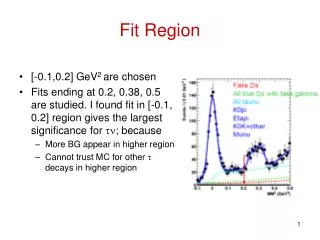
Fit Region • [-0.1,0.2] GeV2 are chosen • Fits ending at 0.2, 0.38, 0.5 are studied. I found fit in [-0.1, 0.2] region gives the largest significance for ; because • More BG appear in higher region • Cannot trust MC for other decays in higher region
Comparison (1) • Eff.’s and shapes from signal MC are weighed average by # tags from data.
Comparison (2) Data # of candidates - sideband Sidebands from 5s Total fake Ds background is 17.0 3.1 in [-0.05, 0.2]
Ds+ t+n; t+ p+n Case 2 Case 1
Other Backgrounds from Ds Expected # for data in [-0.1,0.2] GeV2 Case 2 Case 1 From MC
Fit Technique • Fit detail: a 2D fit • All Shapes in MM2 except fake Ds are fixed to MC, but normalizations are allowed to float • The signal shape in MDs (double Gaussian) obtained from Data when determining Ntag, and fixed • Fake Ds is described by a second order in MM2 and a first order polynomial in MDs, and the three shape parameters are allowed to float
Data Fit (previous tag modes) • Fit sum of two cases • & dependent fit, fix N/N = Rbr Reff =1.059 0.459 = 0.486 • Use the eff. and number of BG in the paper • Breff(Ds+ +) = (0.618 0.056)% [ (0.638 0.059)% in paper] • The 3% lower due to 3% higher in the number of tags # in 17.5 MeV MDs & [-0.1, 0.2] GeV2 MM2 region Fake Ds in [-0.05, 0.2] GeV2 is 9.5 1.9 comparing with data 9.0 2.3
Data Fit (Sum two cases) • & dependent fit • Fix N/N = Rbr Reff =1.059 0.455 = 0.482 • Ntag = 23286 617 • Breff (Ds ) = (0.606 0.050)% • # of fake Ds in [-0.05, 0.2] is 19.2 2.4, consistent with 17.0 3.1 from sideband estimation # in 17.5 MeV MDs & [-0.1, 0.2] MM2 region
Data Fit (case 1) • & dependent fit • Fix N/N = Rbr Reff =1.059 0.243 = 0.256 • Br (Ds ) = (0.588 0.050)% # in 17.5 MeV MDs & [-0.1, 0.2] MM2 region
Data Fit (case 1) • & independent fit • Br (Ds ) = (0.607 0.062)% • Br (Ds t) = (4.9 1.9)% # in 17.5 MeV MDs & [-0.1, 0.2] MM2 region
Data Fit (case 2) • & independent fit • Br (Ds ) = (0.617 0.063)% • Br (Ds t) = (6.0 1.3)% • Br (Ds t) = (5.7 1.1)% from case 1 &2 # in 17.5 MeV MDs & [-0.1, 0.2] MM2 region
Ntags My Fit KKp From CBX