Download
1 / 2
20 likes | 192 Views
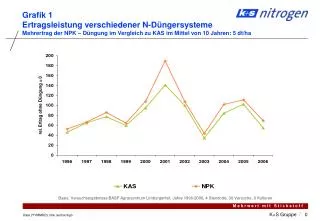
Grafik 1 Ertragsleistung verschiedener N-Düngersysteme Mehrertrag der NPK – Düngung im Vergleich zu KAS im Mittel von 10 Jahren: 5 dt/ha. Basis: Versuchsergebnisse BASF Agrarzentrum Limburgerhof, Jahre 1996-2006, 4 Standorte, 30 Versuche, 6 Kulturen. Grafik 2

E N D
Grafik 1 Ertragsleistung verschiedener N-Düngersysteme Mehrertrag der NPK – Düngung im Vergleich zu KAS im Mittel von 10 Jahren: 5 dt/ha Basis: Versuchsergebnisse BASF Agrarzentrum Limburgerhof,Jahre 1996-2006, 4 Standorte, 30 Versuche, 6 Kulturen
Grafik 2 Die Wirtschaftlichkeit der Phosphat- und Kalidüngung Mittlerer Mehrertrag: 5 dt/ha, ermittelt aus Versuchsergebnissen (1996-2006), BASF Agrarzentrum Limburgerhof Mittlerer Geld – Mehrertrag 12,80 EUR/ha Preise nach RWZ Worms und Meldungen von Land – und Forst, Hannover