Download
1 / 13
130 likes | 223 Views
Combining remote sensing and ancillary data to monitor the gross productivity of water-limited forest ecosystems*. Maselli F. 1 , Papale D. 2 , Puletti N. 3 , Chirici G. 4 , Corona P. 2. 1 CNR- IBIMET, Firenze, Italy 2 University of Tuscia, Viterbo, Italy 3 University of Firenze, Italy

E N D
Combining remote sensing and ancillary data to monitor the gross productivity of water-limited forest ecosystems* Maselli F.1, Papale D.2, Puletti N.3, Chirici G.4, Corona P.2 1CNR-IBIMET, Firenze, Italy 2 University of Tuscia, Viterbo, Italy 3University of Firenze, Italy 4University of Molise, Isernia, Italy *Remote Sensing of Environment 113(2009), 657-667
- Starting from a straightforward forest productivity model (C-fix, by Veroustraete et al. 1994, 2002, 2004), the aim was to develop a procedure of simple implementation (based on widely available EO data) and characterized by easy repeatability in the perspective of quick monitoring on a national level - The C-fix approach is between complex process models based on a large amount of field measurements and very simple empirical models merely based on remotely sensed data
Methodology The work is based on C-fix model, modified z = number of months = 12 i = number of forest and other wooded land categories = 12 GPP = Gross Primary Production (gC m-2 year-1) ε= radiation use efficienty (gC/MJ) Tcor= temperature correction factor fAPAR = fraction of the Absorbed Photosyntetic Active Radiation Gpar = incoming photosynthetically active radiation (MJ m-2 year-1) NEP = 35.2 M t C y-1 Maselli, F., Barbati, A., Chiesi, M., Chirici, G., Corona, P., 2006. Use of remotely sensed and ancillary data for estimating forest gross primary productivity in Italy. Remote Sensing of Environment 100, 563-575. Chirici, G., Barbati, A., Maselli, F., 2007. Modelling of Italian forest net primary productivity by the integration of remotely sensed and GIS data. Forest Ecology and Management 246, 285-295.
Water stress index Cws = 0.5 + 0.5 AET/ PET Where AET and PET are actual and potential evapotranspiration, respectively. For simplicity, AET can be assumed to equal precipitation when this is lower than PET. Consequently, Cws can vary between 0.5 (when strong water shortage reduces photosynthesis to half of its potential value) to 1 (when there is no water shortage and photosynthesis reduction). PET = monthly mean of daily potential evapotranspiration (mm/day); Rs = monthly mean of daily global (total) solar radiation (kJ/m2/day); Ta = monthly mean of daily air temperature (°C). Monthly temperature and radiation maps were used to produce monthly PET maps for the whole study period (1999-2006).
Estimation of Gpar 1 - Estimation of theoretical radiation (G0) based on astronomic formulas of Iqbal (1983)using latitude, slope and aspect from DEM 2 - Conversion from theoretical to real radiation to take into account radiation reduction due to cloud coverage (Benincasa et al.1991) 3 – Comparison to real incoming solar radiation 4 – Conversion of total incoming solar radiation into Gpar
Estimation of fAPAR (fraction of the Absorbed Photosynthetically Active Radiation) for each month and for each forest category fAPAR is basically estimated linearly from NDVI (Myneni e Williams 1994, modified by Veroustraete et al. 2002) fAPARzi = 0.8642 NDVIzi – 0.0814 The relationship is theoretically valid only for pure pixels To estimate the NDVI value of each forest category the locally calibrated end-member estimation method of Maselli (2001) was applied For each forest category and for each month a value of fAPAR was mapped
SPOT-VEGETATION NDVI • - Downloading from VITO dekad MVC • From 1999 to march 2006 • - Low-pass filtering • Monthly maximum value compositing • Resampling to the project geographic system (UTM 32 N)
Fir and spruce Chestnut Exotic coniferous Beech Exotic broadleaves Higro broadleaves (High) Maquis Meso. broadleaves Evergreen oaks Med. pines Mount. pines Dec. oaks Selected forest categories Mapped in a national development of CORINE database to increase the thematic resolution for forest categories Mixed categories for the present project were aggregated to pure ones Original vector data were converted in fuzzy raster format
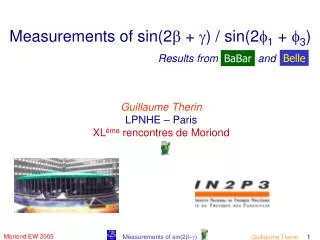
Forest monthly GPP images of Italy obtained by the original C-Fix (a), by the modified C-Fix (b), and difference image (c) for August 2003
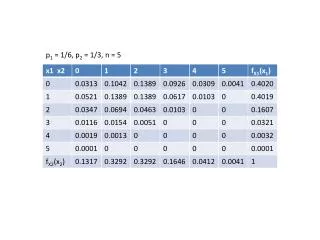
Forest annual GPP images of Italy obtained by the original C-Fix (a), by the modified C-Fix (b), and difference image (c) for 2002
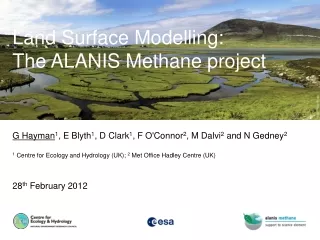
Monthly GPP measured (full circles) and estimated by C-Fix (asterisks) and modified C-Fix (empty circles) at Castelporziano