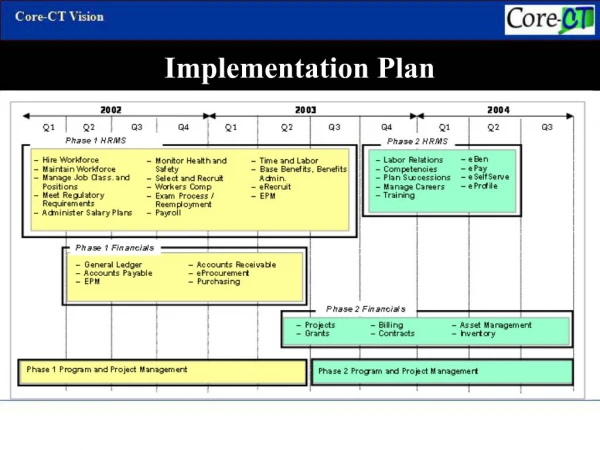
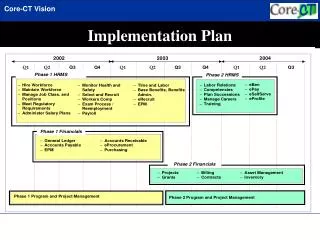
Implementation Plan
Implementation Plan. Every Child a Scientist Workshop Emory University Tiarra L. Moore. Part One: Lesson Plan. Got Hops? Does a person’s leg length affect how far they can jump?. Overview.


Implementation Plan
E N D
Presentation Transcript
Implementation Plan Every Child a Scientist Workshop Emory University Tiarra L. Moore
Part One: Lesson Plan Got Hops? Does a person’s leg length affect how far they can jump?
Overview • During this lesson, students will investigate whether the length of a person’s leg affects how far they can jump. This lesson will take place both indoors and outdoors and will accommodate all learning modalities. The students will use lab books, pencils, meter sticks, tape measures, and masking tape to perform the experiment. During the experiment, students will record their findings in a lab book and graph their results using Excel. This lesson will take approximately 4 hours (4 class periods) to complete.
Primary Learning Outcomes • Students should be able to devise hypotheses, reason, infer, observe, recognize variables, collect evidence, record, measure, use space/time relations, interpret data, classify, draw conclusions, and communicate. These science process skills are covered under Georgia QCC#1.
Assessed QCCs • QCC#1: Uses process skills of observing, classifying, communicating, measuring, predicting, inferring, identifying, and manipulating variables. Also uses recording, analyzing, and operationally defining, formulating models, experimenting, constructing hypotheses and drawing conclusions. • QCC#3.2: Identifies SI units and symbols for length, volume, mass, density, time, and temperature. • QCC#3.4: Uses appropriate tools for determining mass volume, temperature, density, and length.
Materials 1. Chart paper 2. Markers 3. Stopwatches 4. Lab notebooks 5. Pencils 6. Meter sticks 7. Tape measures (metered scale) 8. Masking tape 9. Computers 10. Overhead projector 11. Transparencies
Procedure (Engagement – 75 minutes) • Place the students in groups of four and assign group roles (discussion leader, recorder, reporter, and time keeper) using the Group Roles worksheet as a guide. Give each group 1 piece of chart paper, 1 marker, and 1 stopwatch. • Pique students’ interest by showing them a picture of popular basketball stars, such as Shaquille O’Neal, Kobe Bryant, and Allen Iverson. Ask the students to brainstorm on what qualities they think each player possesses to make them successful in their field and record their ideas on the chart paper provided. The students will be instructed to generate as many ideas as possible, operate in their perspective group roles, and complete their discussion within 1 minute. After each group completes their discussion, the reporter will post their group’s chart paper in a designated location and read their group’s ideas. • Point out some of the best qualities from each piece of chart paper and then introduce the experiment for the day--Got Hops? Does a person’s leg length affect how far they can jump? The teacher will inform the class that before they can perform the experiment, they must understand, and be able to implement, certain process skills. (Pictures courtesy of http://www.google.com)
List and explain the process skills students’ will need to master as well as the skills that will be used during the “Got Hops?” experiment. Tell the students that before they actually perform the “Got Hops?” experiment, they must develop an experimental design. • Give each student an Experimental Design Worksheet and walk them through the process using a mock topic (guided practice): Will bananas brown faster on the counter or in the refrigerator? Have this worksheet on transparencies and complete it using student input. • After the Experimental Design Worksheet is completed using the mock topic, discuss the process with the students and answer any questions. After the students understand how to complete the worksheet, have students complete their individual worksheets for the “Got Hops?” experiment with their group members. • Review the worksheet with the class and discuss any pertinent information.
Procedure(Exploration – 40 minutes) • Tell students to obtain their materials (lab notebooks, pencils, and tape measures) and take them outside. • Demonstrate how to read a tape measure, how each students’ leg should be measured using a tape measure (vertically from the out seam of the leg starting at the middle of the hip bone and ending at the middle of the ankle, with no bend in the knees), and how each jump should be made (place the tip of shoes directly behind the start line and jump forward parallel to the distance scale. Land with both feet together). [Note: Supply a pre-made distance scale marked in 1 meter increments with centimeter markings in between using a meter stick that has been taped to the sidewalk. Designate a jump start line using masking tape on the sidewalk]. • After each student has been briefed on how to make their measurements, allow them to perform the experiment. • First, the students will take the measurement of their group members’ legs using a tape measure. They will record their results in the data table provided. • The students will then, one by one, approach the start line, and give their name as well as their leg measurement. All students will be required to record this data. Ensure that each student starts at the official start line and is positioned correctly. • The student will then jump forward, with their hands clear and wearing rubber-soled shoes, as far as they can parallel to the distance scale. The students will not be allowed to get a “running start,” but must begin in a stationary position at the start line. The distance the student jumps will be read by the jumper’s group members and verified by the teacher. This number will be read aloud for all students to record. • After all of the students have jumped and their jump distances have been recorded, they will gather their materials and return to the classroom.
Procedure(Explanation – 120 minutes) • Once back into the classroom, have students assemble into their original groups. • Ask the students to discuss the results of the experiment and tell if the data proved or disproved their hypotheses. This information will be discussed as a class. Have each group organize their data into a form that can be easily analyzed: create a new table in which the leg lengths of the students are listed in order from shortest to longest and see if there is a correlation between the leg length and the jump distance. Ask each group to develop a written conclusion based on the results of the experiment and share it with the class. Student responses should be written on the board and discussed. • Ask the students to brainstorm on ways the experiment could be performed differently to get the same or more accurate results. These comments should be shared with the entire class and written on the board. • Display a grid on an overhead transparency and ask students how to set up the graph. The variables for the x and y axes should be determined as well as the scale for each axes. Plot the first 3 values on the overhead transparency and tell the students to plot the remaining values, with the help of their team members (line graph). After the students are done plotting their graphs, a student from each group should read aloud the coordinates of the graph as the they are plotted on the overhead projector. Check for any discrepancies between the students’ graphs against the correct graph. • After the graph is complete, have the students transpose their data into an Excel document to produce an electronic graph. Analyze each student’s graph for accuracy and have students analyze the work of their group members. • Have each group create a written report for this experiment and publish their work.
Procedure (Evaluation) • This lesson can be assessed using the following tools: • Rubric (for experimental design worksheet, written report, and student collaboration) • Peer and teacher evaluation • Large group discussion (sharing conclusions from small group discussions) • Oral questioning • Presentation and evaluation of student products
Procedure (Extension) • This lesson can be modified by • Increasing the number of variables in the experiment, such as foot size, height, weight, and gender. • Having students take measurements using both English and Metric Units and convert between the two.
Procedure (Remediation) • Students having difficulty will be given less data to graph, a graphing grid with pre-labeled axes, and will not be required to produce an electronic graph.
Part Two: Peer Education Plan Presentation to Long Middle School Science Teachers: Using Problem-Based Learning Increase Processing Skills Teach the Scientific Method Keep students engaged Increase critical thinking skills
Your solution is here! Use Problem-Based Learning
What is Problem-Based Learning? • Problem-based learning (PBL) is a simple framework by which a teacher can effectively move into a role of educational guide or coach. It also moves the student into an active, engaged, and inquiring role that requires real-life problem-solving processes such as brainstorming, collaboration, research, and presentation skills development. Problem-based learning promotes authentic assessment, presentation, and performance to communicate the results of inquiry.
Let’s put PBL into action! Problem-Based Learning
FACTS QUESTIONS HYPOTHESES LEARNING ISSUES Directions • Get into a group with three other people • Assign yourself a role from the Group Roles list • Using your chart paper and markers, create a chart that looks like this:
Case Study – Scene 1 Tom and Kathy Brown live in a farm in rural Missouri with their two sons: Kyle, 3, and Rick, 8. Tom takes care of the farm while his wife works as a secretary at a local law firm. One Saturday, while cleaning the house, Kathy notices that the food supplies are low. She goes into town to buy groceries and leaves Tom to take care of the kids. Tom, hot and sweaty after mowing the lawn, decides to take a quick shower. The boys, eager to play, sneak outside. Only later does Tom hear the children screaming from the back yard. He quickly rushes outside and finds a horrifying scene...
QUESTIONS FACTS HYPOTHESES LEARNING ISSUES Fill in your T-Charts with the appropriate information from Scene 1
Case Study – Scene 2 Kyle is bleeding from the chin, while Rick is holding his left forearm. The snake that bit the children is slithering off into the nearby woods. Tom fetches a hoe and cuts off the snake's head. He quickly wraps a tourniquet around Rick's arm and bundles the kids into the car. Knowing that he will need the snake, he tosses the head and body into a sack and races toward the hospital. Sadly, Kyle dies at the hospital, and Rick is placed in critical condition. The patient chart beside his bed reads, "Diagnosis: Venomous snake bite. Symptoms: low blood pressure, swelling, hemorrhaging and initial tissue necrosis in left forearm. Urine discolored.” (Picture courtesy of http://bioquest.org/lifelines/summer2002/santos_bassham.htm)
In the meantime, the snake was sent to the local university. There, a herpetologist examined the snake and made the following notes. A couple of days pass, and Rick's condition improves significantly. Dr. Smith takes the Tom and Kathy to his office and says, "Rick's condition is very delicate, but he is recovering. The snake that bit your boys was not one of the most dangerous species known. However, I've read some research that talks about how some snakes seem to be evolving more harmful venoms. I will see if I can find more information on this issue. The good news is, Rick is going to be alright!"
QUESTIONS FACTS HYPOTHESES LEARNING ISSUES Fill in your T-Charts with the appropriate information from Scene 2
Using the information gained from the two scenes, design an experiment to determine which venom types cause death in humans.
Learning Outcomes • Identify external morphology of snakes for classification purposes • Explore venom types and their physiological effects on humans • Elaborate on the adaptations occurring in the snake to help it survive in its environment • Identify the relevance of snakes for humankind and human beliefs about snakes
Student Products • Pamphlet describing how to differentiate between venomous and non-venomous snakes. • Newspaper article describing misconceptions involving snakes as well as the different ways that snakes are viewed by distinct cultures. • A report detailing the physiological effects of snake venom on the human body • A poster demonstrating snake adaptations to the environment (predatory behavior, venom, physiology, anatomy, etc)
Student Assessment • Test questions based on student presentations • Large group discussion (sharing conclusions from small group discussions) • Peer evaluation • Presentation and evaluation of student products
References • "Is Rattlesnake Venom Evolving?"http://www.amnh.org/naturalhistory/features/0700_feature.html • "Is Rattlesnake Venom Evolving?" The Cold Blooded News: The Newsletter of the Colorado Herpetological Society.http://coloherp.org/cb-news/cbn-0009/Venom.html • "Safety Information: Rattlesnake Bites"http://wellness.ucdavis.edu/safety_info/poison_prevention/poison_book/rattlesnake_bites.html • "Snakes of North America"http://www.pitt.edu/~mcs2/herp/SoNA.html • "Herps of Texas-Snakes"http://www.zo.utexas.edu/research/txherps/snakes/ • "Georgia Museum of Natural History"http://museum.nhm.uga.edu/index.html
PBL Resources • http://www.pbli.org/ • http://www.cse.emory.edu/sciencenet/coll_curr/pbl_links.html • http://www.cse.emory.edu/prism/ • http://www.bioquest.org:16080/lifelines/prism/resources.php • http://www.udel.edu/pbl/problems/ • http://meds.queensu.ca/medicine/pbl/pblhome.htm • http://www.mcli.dist.maricopa.edu/pbl/lodestar_8_97.html • http://edweb.sdsu.edu/clrit/learningtree/Ltree.html
PBL Investigative Cases • http://www.udel.edu/pbl/others.html • http://ublib.buffalo.edu/libraries/projects/cases/case.html • http://ublib.buffalo.edu/libraries/projects/cases/ubcase.htm • http://ublib.buffalo.edu/libraries/projects/cases/biblio.htm • http://ublib.buffalo.edu/libraries/projects/cases/article.htm • http://bioquest.org/lifelines/summer2002/cases_2002.htm • http://bioquest.org/lifelines/emory/ • http://www.bioquest.org/ • http://serc.carleton.edu/introgeo/icbl/index.html
Now that we know what to do… Let’s get busy!!!