Download

1 / 50
520 likes | 856 Views
STUDY DESIGN CASE SERIES AND CROSS-SECTIONAL. Daniel E. Ford, MD, MPH Vice Dean for Clinical Investigation Johns Hopkins School of Medicine Introduction to Clinical Research July 14, 2010. STUDY DESIGN. Provides “differential diagnosis” of a study’s strengths and weakness

E N D
STUDY DESIGNCASE SERIES AND CROSS-SECTIONAL Daniel E. Ford, MD, MPH Vice Dean for Clinical Investigation Johns Hopkins School of Medicine Introduction to Clinical Research July 14, 2010
STUDY DESIGN • Provides “differential diagnosis” of a study’s strengths and weakness • Determines confidence in results of study • Facilitates critical appraisal of the medical literature • Linked to research question
STUDY DESIGNS AND CORRESPONDING QUESTIONS • Ecologic • What explains differences • between groups? • Case Series • How common is this finding • in a disease? • Cross-sectional • How common is this disease • or condition? • Case-control • What factors are associated • with having a disease? • Prospective • How many people will get the disease? • What factors predict development? • Randomized trial If we change something does the • outcome change
STUDY DESIGNDEFINITIONS • Based on sampling strategy, i.e., how we choose who gets into the study • Sampling with regard to disease: cross-sectional and case-control studies • Sampling with regard to exposure or treatment: prospective studies
CRITERIA FOR CAUSAL INFERENCE • Experimental evidence • Temporality • Strength of the association • Dose-response relationship • Consistency in different populations • Specificity: exposure leads to only 1 disease • Biologic plausibility • Coherence • Analogy
HIERARCHY OF STUDY DESIGNS RCTs Prospective Studies Case-control Studies Cross-sectional Studies Ecologic Studies
STUDY DESIGNEXAMPLE • Does higher dose of dialysis (Kt/v) result in lower mortality in hemodialysis patients?
ECOLOGIC STUDIES • Sometimes called correlational studies • Compares outcomes between groups, not individuals • Useful to examine trends over time or to explain differences between groups
VITAL STATISTICS • Common data source for ecologic studies • Describes disease patterns in entire geographic or political populations • Routinely collected information from birth and death certificates; allow comparisons between countries over time • Comparison by age, race, sex, geographic areas and time period
VITAL STATISTICSADVANTAGES • Inexpensive • Representative of large groups and large geographic areas • Available over long periods of time • Uniform coding rules
VITAL STATISTICSDISADVANTAGES • Group “ecologic” data -- not individual • Uncertain accuracy of diagnoses • Changes in ICD codes • Variability in coding practices • Limited to available data • Mortality may not reflect incidence
ECOLOGIC STUDIES DISADVANTAGES • Subject to ecologic fallacy • Lead to unusual conclusions if not testing biologically plausible hypotheses • Usually done early in the investigation of a research question when cohort studies or clinical trials not available
STUDY DESIGNS AND CORRESPONDING QUESTIONS • Ecologic • What explains differences • between groups? • Case Series • How common is this finding • in a disease? • Cross-sectional • How common is this disease • or condition? • Case-control • What factors are associated • with having a disease? • Prospective • How many people will get the disease? • What factors predict development?
CASE REPORTS • Make observations about medical phenomena in an individual patient • Simple description of clinical data without comparison group • Observations should be comprehensive and adequately detailed
Kt/V AND MORTALITYCASE REPORT • 55 year old man has been on dialysis for 35 years • On home dialysis daily during that time • No evidence of hypertension, cardiovascular disease, LVH
CASE REPORTSADVANTAGES • Easy and inexpensive to do in hospital • Provides information on new disease or new therapy • Useful in conveying “clinical experience” • Helpful in hypothesis formation
CASE REPORTSDISADVANTAGES • Biased selection of subjects so that conclusions are difficult to generalize • Were the findings a chance happening or characteristic of the disease? • Is the “exposure” really higher than a comparison group?
CASE REPORTSEXAMPLES • Asbestos and mesothelioma • Pneumocystis pneumonia • Legionnaire’s Disease
DECIDING TO PUBLISH • What observations have been made prior to this report? • What new phenomenon is illustrated? • What further studies should be done?
CASE SERIES • Group of patients with a disease or outcome • Usually consecutive series • Detailed observations • No comparison group – difficult to address etiologic questions
DISTRIBUTION OF Kt/V IN100 PATIENTS WHO DIED DURING THE FIRST YEAR OF DIALYSIS • review records on 100 patients who died
CASE SERIESOBSERVATIONS • Should have clear definitions of the phenomena being studied • These same definitions should be applied equally to all individuals in the series • All observations should be reliable and reproducible (consider blinding)
CASE SERIESPRESENTATION OF FINDINGS • Proportions (% per 105, etc.) of the study populations with the outcome, confidence intervals • Means, standard errors for continuous variables • Are there important subgroups that need data presented separately?
CASE SERIESADVANTAGES • Informs patients and physicians about natural history and prognostic factors • Easy and inexpensive to do in hospital settings • Helpful in hypothesis formation
CASE SERIESLIMITATIONS • Cases may not be representative • Outcome may be a chance finding, not characteristic of disease • Cannot easily examine disease etiology • Exposure reflects the underlying population, not the outcome • Begs the question “Compared to what?”
STUDY DESIGNS AND CORRESPONDING QUESTIONS • Ecologic • What explains differences • between groups? • Case Series • How common is this finding • in a disease? • Cross-sectional • How common is this disease • or condition? • Case-control • What factors are associated • with having a disease? • Prospective • How many people will get the disease? • What factors predict development?
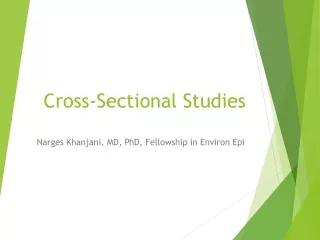
CROSS-SECTIONAL STUDIES • Make observations concerning the prevalence and characteristics of a disease in a well-defined population over a defined period of time (period prevalence) • Estimate prevalence • Examine characteristics associated with condition or disease by comparing cases to noncases
CROSS-SECTIONAL STUDIESDESIGN non-cases cases
MEAN BLOOD PRESSURE BY AGE AND GENDER, U.S., 1991 Burt, Hypertension, 1995
Number of Medicare ESRD Patients on Dialysis in the United States
SAMPLING • Process of obtaining a sample of a population for study • In clinical research, goal should always be a representative sample • Variety of methods available
CROSS-SECTIONAL STUDIES SAMPLING THE POPULATION • Derive a sampling “frame” • Choose a sampling strategy • Maximize response rate
CROSS-SECTIONAL STUDIES TYPES OF SAMPLING • Simple random--each individual has the same probability of being chosen • Stratified random--if most variance is between strata, gives lower sampling variance • Systematic—used commonly in clinical research, akin to stratified random sample if list is ordered • Cluster
RESPONSE RATES AND SAMPLING • Sample size of 500 • 5% of 10,000=500 • 75% of 666=500 • Which study provides the most valid causal inference? • Are persons who do not respond (can’t be found or say no) likely to be different than those who do?
NONRESPONSE IN SAMPLINGCROSS SECTIONAL STUDIES • Minimize non-response • smaller sample size allows more intensive recruitment • collect data on non-responders, if possible • intensively recruit a sub-sample of non-responders
CROSS-SECTIONAL STUDIESADVANTAGES • Inexpensive for common diseases • Should be able to get a better response rate than other study designs • Relatively short study duration • Can be addressed to specific populations of interest
CROSS-SECTIONAL STUDIESDISADVANTAGES • Unsuitable for rare or short duration diseases (prevalence = incidence x duration) • High refusal rate may make accurate prevalence estimates impossible • More expensive and time consuming than case-control studies • Disease process may alter exposure • No data on temporal relationship between risk factors and disease development
Defining Cross-Sectional Studies • How short is the assessment period? • Symptom questionnaire and then physical exam • Cases accumulated over long period of time • Time trends of multiple cross-sectional studies (smoking rates in population over time)
STUDY DESIGNS AND CORRESPONDING QUESTIONS • Ecologic • What explains differences • between groups? • Case Series • How common is this finding • in a disease? • Cross-sectional • How common is this disease • or condition? • Case-control • What factors are associated • with having a disease? • Prospective • How many people will get the disease? • What factors predict development?