Download
1 / 15
150 likes | 241 Views
Explore NSF statistics on R&D spending, workforce demographics, education participation, degree distribution, and faculty ranks to advance gender and minority inclusion. Gain valuable insights for promoting diversity in STEM.

E N D
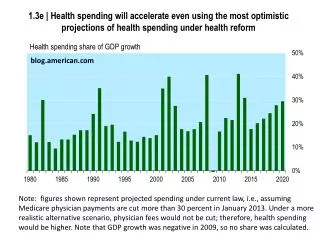
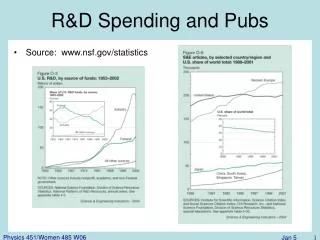
R&D Spending and Pubs • Source: www.nsf.gov/statistics
Workforce • NSF 2004
S&E Degrees per 24 yr old • NSF 2004
Faculty Age Distribution • NSF04
Foreign Participation • NSF04
Female Education Participation • NSF04 Bachelors awarded Ph.D.’s awarded Graduate enrollment
URM education participation • NSF04 Bachelors, % Ph.D., Numbers Diff Degrees, %
URM Age/Salary Distribution • NSF04
Faculty Rank - women • NSF04
Physics vs. Chemistry Pipeline % women at “top 50” Asst Assoc Full Physics women 2x as likely to be at UG Institutions (14% vs. 7% faculty) • AIP Study on Academic Women in Physics
Engineering Degrees • NSF
Females in Workforce • NSF04