Statistical Analysis Essentials: A Guide for Data Interpretation
Understand fundamental statistical concepts, from sample representation to variable measurement, and learn about inferential statistics and frequency distributions. Includes graphing data techniques like histograms, boxplots, and normal distribution analysis.

Statistical Analysis Essentials: A Guide for Data Interpretation
E N D
Presentation Transcript
Basic Statistical Review EPS 625 – Intermediate Statistics Robert A. Horn, Ph.D.
Key Terms • Sample • Statistic • Representative of the population • Commonly symbolized with Roman Letters • Population • Parameter • Commonly symbolized with Greek Letters • Sampling • Random Sample • Random Assignment
Key Terms • Variables • Categorical (Nominal – Ordinal) • Discrete • Qualitative • Frequency • Continuous (Interval – Ratio) • Quantitative • Measurement
Key Terms • Independent (Predictor) Variable • Active (experimental) • Attribute (measured) • Dependent (Criterion) Variable • Extraneous Variable • Confounding • Third Variable
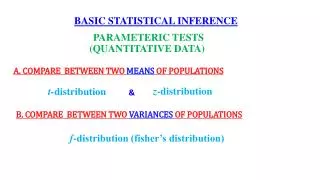
Key Terms • Descriptive Statistics • Measures of Central Tendency • Mean, Median, Mode • Measures of Variability • Range, Standard Deviation, Variance • Inferential Statistics • Parametric • Nonparametric
Describing Distributions • Symmetric (Normal Distribution) • Modality • Unimodal, Bi-Modal, Multi (tri)-Modal • Skewness • Negative, Normal (Symmetrical), Positive • Kurtosis • Platykurtic, Mesokurtic (Normal), Leptokurtic • Linearity • Linear or Curvilinear
Summation Notation () • One of the most common symbols in statistics is the uppercase Greek letter sigma, (), which is the standard notation for summation. • It is readily translated as “add up, or sum, what follows.” • The general rule, which always applies, is to perform operations within parentheses before performing operations outside parentheses.
Common Statistical Symbols • X A Raw Score • Mean of a Sample • Mean of a Population • s Standard Deviation of a Sample • Standard Deviation of a Population • s 2 Variance of a Sample • 2 Variance of a Population
Key Terms • Probability • = Level of Significance • p = Probability (Sig.) • Confidence Intervals • Effect Size • d Family • r Family • Standard Scores • z •
Statistical Results and APA t(9) = 5.08, p < .05, d = 1.61 F(2, 57) = 9.75, p < .01, 2 = .42 | = Single Space NOT t(9)=5.08,p<.05,d=1.61 F(2,57)=9.75,p<.01,2=.42