Download
1 / 36
360 likes | 502 Views
Why Don’t We Talk Anymore?. Developing a Language for Procurement Data. Speakers. Greg Macway – Strategic Coordinator University of California, San Francisco University of California, Berkeley greg.macway@UCSF.edu Erin Riley – Analytics & Reporting Manager

E N D
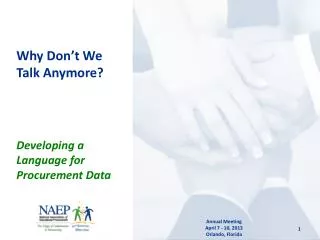
Why Don’t We Talk Anymore? Developing a Language for Procurement Data Annual Meeting April 7 - 10, 2013 Orlando, Florida
Speakers • Greg Macway – Strategic Coordinator University of California, San Francisco University of California, Berkeleygreg.macway@UCSF.edu • Erin Riley – Analytics & Reporting Manager University of California, Office of the Presidenterin.riley@UOCP.edu Annual Meeting April 7 - 10, 2013 Orlando, Florida
The Language of Procurement Word Cloud - Indiana University Procurement Bloghttp://iuprocurement.wordpress.com/
Do we have the SAME Procurement language? Word Cloud – NAEP 2013 Program
The Story of UC Foreword What is University of California Procurement? Prologue: Why we don’t talk, and what it was costing us Chapter 1How we started the conversation Chapter 2How we embraced the language Chapter 3Stories of success Epilogue The next adventure
About the University of California We are BIG • 500 Miles from Northernmost to Southernmost Campus • 10 Campuses & Office of the President • 234,000 Students • 210,000 Employees & Faculty • $23 Billion Annual Operating Budget • 101st largest economy in the world. (between Tanzania and El Salvador) #15 in Olympic medal count (sorry Canada) #7 in Gold medal count (sorry China)
UC Procurement Statistics • $5.6B in Annual Spend • 155k Vendors • 500k Vendor Records • 1.1M Purchase Orders • 2.8M Invoices • 5.8M Transaction Lines (excluding P-card)
UC Procurement Organization(s) • De-centralized Model • No System-wide Purchasing, Accounts Payable or Information Technology • 11 Procurement Departments • Varying levels of Procure-to-Pay ownership and influence • 9 ERP Systems • Peoplesoft, Banner, Walker, Homegrown/Legacy • 8 Ecommerce Instances • 6 SciQuest, CommerceOne/PerfectCommerce, Homegrown • Fund Based Accounting • Lots of Buckets of Money • Lots of Varying Needs Organic Growth in a Silo
So, why don’t we talk? What we Buyvs What we Get
The consequences of silence • In one month, UC Office of the President made 29 requests for procurement data. • 10 campuses • 1 analyst @ 2.5hrs per request per campus • 725 hours of data collection hours • System wide contract pricing neglected • 5 year strategic plans became stale • A lack of collaboration and trust between schools Annual Meeting April 7 - 10, 2013 Orlando, Florida
A Change in the Wind • 9/2011 System Wide Vision for Spend Analytics • Answer simple questions, quickly • Be flexible in accepting data • Allow for continuous development • Reduce the effort required to analyze spend • Create standards in procurement data • Launched an RFP 11/2011 • Awarded to Spend Radar 01/2012 • World Ends 12/2012…. Got to get to work Vision Document Annual Meeting April 7 - 10, 2013 Orlando, Florida
We needed common definitions • We knew we had a Data problem… • …but it was secondary to a Communication problem • How do we overcome • complexity of systems • diversity of knowledge • varying needs • between campuses and develop a best in class solution? Multi-Campus Fight to the Death!
2-day Definition Workshop • Cross functional group, 20 people • Accounting • Purchasing • Information Technology • Discussed differences across campuses • Spent as much time in the clouds as we did in the weeds • Broke down barriers of • “It depends” • “That’s just how it’s always been done”
Workshop Outcome (Guiding Principles) • Since Procurement didn’t have definitions, use a group that did, Accounts Payable • GASB terms and principles where applicable • Spend originates at the General Ledger. All other activities/documents are supportive/secondary • Use existing objects/definitions rather than creating new ones. (avoid cross object definitions and language)
Scope Definitions • Keep the data request to campuses “simple, but inclusive”. • asked for all data related to objects, not specific fields (give us all data in tables related to POs) • Only include data from objects from campus financial systems (Invoices, POs, Vendor, Org). Not secondary systems. • Keep data inclusive and intact. Don’t engineer around errors/flaws. • Accept we’re not going to be perfect.
Definitions guided our Implementation • The data request to IT groups was very clear • Immediately showed gaps in campus data • Acted as an anchor for follow up conversations • Normalized Employee Reimbursements • Employee names were masked • US Bank integration (future opportunity) • Could not tie transactions back to the GL • Decided to include data, but report separately
Answering Simple Questions What are we buying? Who are we buying from? • Who is our Audience? • Who is buying? • What is being bought? • Who are we buying from? • How are we buying? • Bonus: How is my data filtered Who is buying? How are we buying?
No Roles, No Hidden Data • Started with Roles based approach • Executives developing system wide strategies • Buyers looking for historical buy info • Strategic Analysts looking for sourcing opportunities • Because of the flexibility of the tool, our solutions met the needs of all three groups. • Differentiated specific value via training
What am I looking at? Filters • Search Box (A) – input data elements to find in solution • Overview Information (B) – quick information view such as filtered spend, number of Vendors, POs, Invoice, Lines, Date Range • Data Source (C) – select between campus financial system data or US Bank Pcard data • Campus Filter (D) – select all, multiple, or single campus data view • Date Select (E) – data can be filtered by date range criteria such as quarter, month, year • Current Selections (F) – displays the current selections user has selected A B C D E F
Challenges / Hurdles Where are my resources?
Challenges / Hurdles Innovation = Lack of Experience
Challenges / Hurdles No change management fairy godmother
Challenges / Hurdles Working with (and around) IT Groups
Success Stories • Everybody wants it! • Strategic Planning • Category Management • Outside-the-box Solutions Success Pic Goes Here
The Future Looks Good • More Shared Definitions • Expansion of Audience • Additional Data Sources • Additional Analysis • Contract Analysis • Sustainability/Small Business Reporting • Operational Metrics • P-Card Program • Vendor Performance Analysis
Thank You! Greg Macway greg.macway@UCSF.edu Erin Riley erin.riley@UOCP.edu