Download
1 / 28
290 likes | 398 Views
Measurement Uncertainties and Inconsistencies. Dr. Richard Young Optronic Laboratories, Inc. Introduction. The concept of accuracy is generally understood. “…an accuracy of 1%.” What does this mean? 99% inaccurate?. Introduction.

E N D
Measurement Uncertainties and Inconsistencies Dr. Richard Young Optronic Laboratories, Inc.
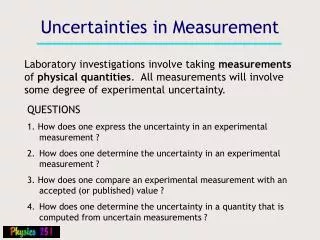
Introduction • The concept of accuracy is generally understood. • “…an accuracy of 1%.” • What does this mean? • 99% inaccurate?
Introduction • The confusion between the concept and the numbers has lead national laboratories to abandon the term accuracy. • Except in qualitative terms e.g. high accuracy. • The term now used is uncertainty. • “…an uncertainty of 1%.”
Introduction • Sometimes… • Users do not know the uncertainty of their results. • They interpret any variations as inconsistencies.
Uncertainty vs. Inconsistency • Laboratories give different values, but the difference is within their combined uncertainties… • Pure chance. • Laboratories give different values, and the difference is outside their combined uncertainties… • Inconsistency.
What is uncertainty? • “…an uncertainty of 1%.” • But is 1% the maximum, average or typical variation users can expect? • Uncertainty is a statistical quantity based on the average and standard deviation of data.
Statistics “There are three types of lies: lies, damned lies and statistics.” -attributed to Benjamin Disraeli “The difference between statistics and experience is time.” -Richard Young Statistics uses past experience to predict likely future events.
These 2 are the same and hence twice as likely to happen as the others. Statistics • We toss a coin: • It is equally likely to be heads or tails. • We toss two coins at the same time: • There are 4 possible outcomes: • Head + Head • Head + Tail • Tail + Head • Tail + Tail
Statistics • Now let us throw 10 coins. • There are 1024 possibilities (210). • What if we threw them 1024 times, and counted each time a certain number of heads resulted…
Statistics • Although the outcome of each toss is random… • ...not every result is equally likely. • If we divide the number of occurrences by the total number of throws… • We get probability.
Statistics • Here is the same plot, but shown as probability. • Probability is just a number that describes the likelihood between: • 0 = never happens • 1 = always happens
Statistics • Gauss described a formula that predicted the shape of any distribution of random events. • Shown in red • It uses just 2 values: • The average • The standard deviation
And a standard deviation = 5 Statistics • Now throw 100 coins… We have an average = 50 The Gaussian curve fits exactly. And the familiar bell-shaped distribution.
Confidence • Now throw 100 coins… Since the total probability must =1, the standard deviation marks off certain probabilities.
Confidence • Now throw 100 coins… Since the total probability must =1, the standard deviation marks off certain probabilities. About 67% of all results lie within 1 standard deviation. “I am 67% confident that a new throw will give between 45 and 55 heads.”
Confidence • Now throw 100 coins… Since the total probability must =1, the standard deviation marks off certain probabilities. About 95% of all results lie within 2 standard deviations. “I am 95% confident that a new throw will give between 40 and 60 heads.”
Real Data • Real data, such as the result of a measurement, is also characterized by an average and standard deviation. • To determine these values, we must make measurements.
Real Data • NVIS radiance measurements are unusual. • The signal levels at longer wavelengths can be very low – close to the dark level of the system. • The signal levels at longer wavelengths dominate the NVIS radiance result. • The uncertainty in results close to the dark level can be dominated by PMT noise. • Therefore: Variations in NVIS results can be dominated by PMT noise.
Real Data • The net signal from the PMT is used to calculate the spectral radiance. • Dark current, which is subtracted from each current reading during a scan, contains PMT noise. • Scans at low signals contain PMT noise.
Real Data • PMT noise present in each of these current readings does not have the same effect on results: • A high or low dark reading will raise or lower ALL points. • Current readings during scans contain highs and lows that cancel out to some degree.
Real Data Excel: “= average()” 2E-12 Excel: “= stdev()” 1E-13
Calculations • We can describe the effects of noise on class A NVIS radiance mathematically: • s is the standard deviation of the noise • C() is the calibration factors • GA() is the relative response of class A NVIS Signal averaging Dark subtraction
Calculations • A similar equation, but using NVIS class B response instead of class A, can give the standard deviation in NVISb radiance. • The standard deviations should be scaled to the luminance to give the expected variations in scaled NVIS radiance.
Calculations • Noise can be reduced by multiple measurements. • If we generalize the equation to include multiple dark readings (ND) and scans (S): Brain overload
Spreadsheet Moving on to the benefits… Introducing The Spreadsheet