Download
1 / 1
10 likes | 167 Views
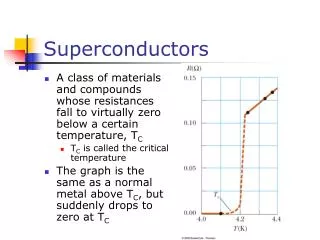
BiO. SrO. Gap Magnitude vs. k. CuO 2. Ca. DOS(E) after average over k. a » b = 5.4 Å. CuO 2. c = 30.7 Å. SrO. BiO. BiO. dI/dV. SrO. T c ~ 90 K. CuO 2. Ca. -300 -150 0 150 300. Calculated. Sample Bias [mV]. CuO 2. Intense spatial variation

E N D
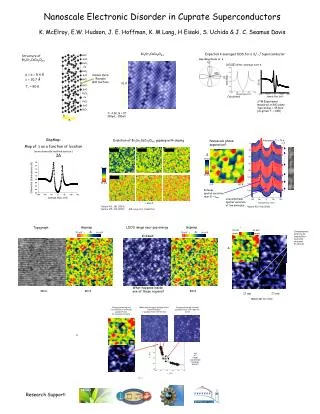
BiO SrO Gap Magnitude vs. k CuO2 Ca DOS(E) after average over k a » b = 5.4 Å CuO2 c = 30.7 Å SrO BiO BiO dI/dV SrO Tc ~ 90 K CuO2 Ca -300 -150 0 150 300 Calculated Sample Bias [mV] CuO2 Intense spatial variation near E ~Dmax STM Experiment measured on BiO plane Typical Gap 45 meV [as-grown Tc 89K] SrO BiO Low amplitude spatial variation at low energies b a Nanoscale Electronic Disorder in Cuprate Superconductors K. McElroy, E.W. Hudson, J. E. Hoffman, K. M Lang, H Eisaki, S. Uchida & J. C. Seamus Davis Bi2Sr2CaCu2O8+d Expected k-averaged DOS for a dx2-y2 Superconductor Structure ofBi2Sr2CaCu2O8+d Cleave Here Reveals BiO Surface 70 Å T= 4.2K, B = 0T 100pA, -100mV GapMap: Map of D as a function of location (on an atomically resolved surface ) Evolution of Bi2Sr2CaCu2O8+d gapmap with doping Nanoscale phase separation? Underdoped: Tc = 75 K p ~ 0.11 p ~ 0.13 p ~ 0.14 D 2D 75 mV 70 mV 0 Å 147 Å 30 mV 91126153 from typical linecut on Ni BSCCO 177/11113a00 180/20219a00 p ~ 0.16 p ~ 0.17 p ~ 0.19 20 mV ~ 600 Å Nature 413, 282 (2001) Nature 415, 412 (2002) Nature 415, 412 (2002) K.M. Lang et al Submitted. LDOS image near gap energy Gapmap Gapmap Topograph D 64 mV 20 mV D D Commensurate q=(2p/a0,0) modulations seen only wherever E=D(local) 20 mV 64 mV 20 mV 64 mV D D 20 mV 60 mV E=24mV A) B) D 40Å -24 mV D) C) -50 mV What happens inside one of these regions? -34 mV 640 Å 640 Å 640 Å 23 nm 23 nm Nature 422, 520 (2003). Strong scattering and ~localization of antinodal quasiparticles by nanoscale domains Weak scattering of quasiparticles 5meV<E<30meV => quasiparticle interference Strong scattering of nodal quasiparticles from impurity atoms A) D 40Å B) ALL AT SAME LOCATION IN REAL SPACE ! -24 mV Research Support: