Download
1 / 7
70 likes | 212 Views
Fig. 1 Supplement. 70.00. 60.00. 50.00. Fold change. 40.00. mir-10a. mir-130a. 30.00. 20.00. 10.00. 0.00. HELA. MCF7. 293A. JURKAT. NIH/3T3. HL60. COS7. Fig. 2 Supplement. 120. 100. 80. NIH/3T3 HyTK. NIH/3T3 TKpuro. Percentage. 60. NIH/3T3 TKzeo. NIH/3T3 Control. 40.

E N D
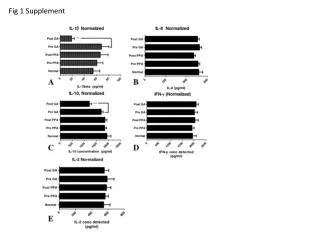
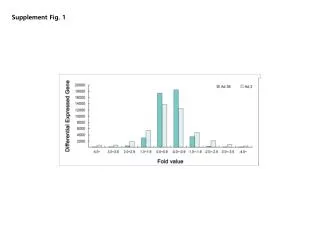
Fig. 1 Supplement
70.00 60.00 50.00 Fold change 40.00 mir-10a mir-130a 30.00 20.00 10.00 0.00 HELA MCF7 293A JURKAT NIH/3T3 HL60 COS7 Fig. 2 Supplement
120 100 80 NIH/3T3 HyTK NIH/3T3 TKpuro Percentage 60 NIH/3T3 TKzeo NIH/3T3 Control 40 20 0 0 μM 1 μM 2 μM 3 μM 6 μM 12 μM Concentration GCV Sensitivity Day 10 FIG.3 Supplement
7 6 5 Fold change 4 3 2 1 0 MCF7+ lib MCF7+ lib + mir-130a Fig. 4 Supplement
Day 1 Day 30 Day 60 Day 70 Fig. 5 Supplement
mir-10a MCF7 MCF7 mir-10a MCF7 mir-130a MCF7 MCF7 mir-10a MCF7 mir-130a Fold change mir-130a MCF7 MCF7 mir-10a MCF7 mir-130a MCF7 MCF7 mir-10a MCF7 mir-130a Transient Stable Fig. 6 Supplement
KIF-AP3 expression 2 NIH/3T3 1.5 2 1 C relative intensity 1 KIFAP3 0.5 0 CYP27A1 cell lysate C 1 2 tubulin CYP71A1 expression 1.4 1.2 1 0.8 0.6 0.4 0.2 0 cell lysate C 1 2 relative intensity Fig. 7 Supplement