Download
1 / 1
10 likes | 170 Views
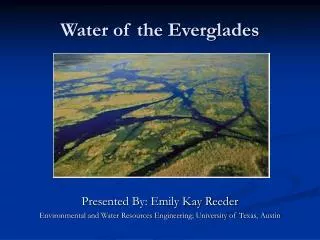
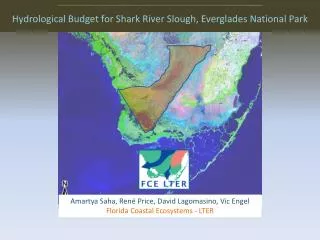
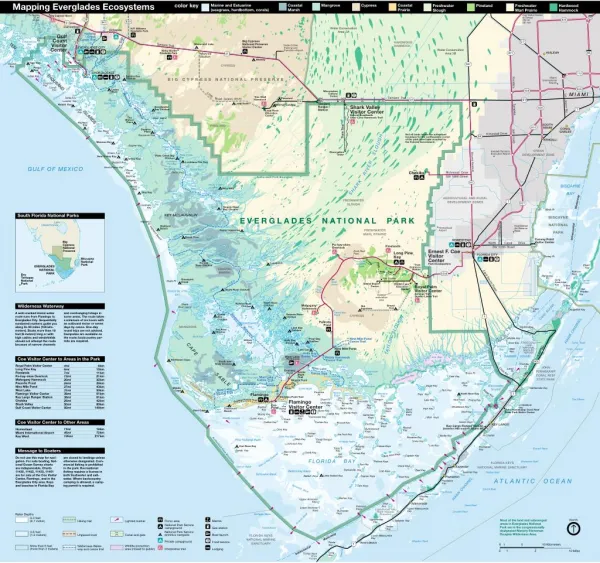
Figure 1. Map of Everglades National Park. CONTACT. Picture 1. Picture 2. Jose Bazante and Helena M. Solo-Gabriele University of Miami, Dept. of Civil, Arch., and Environmental Engineering,, Coral Gables, Florida jbazante@bellsouth.net hmsolo@miami.edu. Figure 3. Figure 4.

E N D
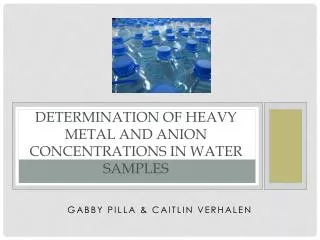
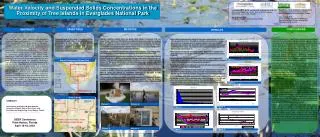
Figure 1 Map of Everglades National Park CONTACT Picture 1. Picture 2. Jose Bazante and Helena M. Solo-Gabriele University of Miami, Dept. of Civil, Arch., and Environmental Engineering,, Coral Gables, Florida jbazante@bellsouth.nethmsolo@miami.edu Figure 3 Figure 4 GEER Conference Palm Harbor, Florida April 16-18, 2003 Picture 3 Picture 4 Figure 6 Figure 5 Water Velocity and Suspended Solids Concentrations in the Proximity of Tree Islands in Everglades National Park Michael Ross, Ph.D. and Daniel L. Childers, Ph.D. Southeast Environmental Research Center, Florida International University, Miami, Florida Lynn Leonard, Ph.D. University of North Carolina at Wilmington, Department of Earth Science and Geology, Wilmington, North Carolina Jose Bazante M.S., M.B.A. and Helena M. Solo-Gabriele, Ph.D., P.E. University of Miami, Dept. of Civil, Arch., and Environmental Engineering,, Coral Gables, Florida Sherry Mitchell, Ph.D. Everglades National Park, Homestead, Florida OBJECTIVES METHODS CONCLUSIONS ABSTRACT RESULTS • Spatially intensive velocity data are being taken along 3 transects that are perpendicular to the main North-South axis of each island, using a Sontek handheld device (Picture 2). The first and northern-most transect is located by the island’s tropical hardwood hammock (head), the second transect is located near the middle and the third is located close to the tail of the island. Each transect has its origin to the west of the tree island and has a station every 5 meters. • One Sontek Argonaut ADV autonomous velocity meter has been installed near each tree island to obtain temporally intensive velocity in three dimensions (Picture 3) • Suspended sediments are characterized along the transects. Samples are collected without filtration for turbidity, particle size distribution and number of particles per ml analyses. The latter two are performed with a Coulter Counter Particle Size Analyzer (Picture 4). The gravimetric analysis of total suspended solids, volatile suspended solids and non- volatile suspended solids is being conducted by sampling with an in- line filtration system (Picture 1) • The experimental procedure for the suspended sediment density analysis requires the collection of at least 1 gram of suspended sediment, with up to 5 grams as ideal. In order to collect this amount of suspended sediments we will need to filter approximately 1000 gallons of water through a yarn wound filter. • Tests using dyes and tracers will be conducted in order to test if the acoustic Doppler systems are underestimating water velocity through vegetation, since the Doppler system requires that an area be cleared of vegetation between the sampling volume and the transducers. This study quantifies water velocities and determines suspended sediment characteristics in the vicinity of 3 tree islands situated in the Shark Valley Slough in Everglades National Park. The three islands are known as Black Hammock, Gumbo Limbo and Satin Leaf. Spatially intensive velocity data are being taken along 3 transects that are perpendicular to the main North-South axis of each island, using a handheld Sontek Acoustic Doppler Velocity Meter. An autonomous Sontek Argonaut ADV velocity meter deployed at each tree island will continuously record temporally intensive data. Suspended sediments are also being characterized along the transects. Gravimetric analysis of total suspended solids, volatile suspended solids and non-volatile suspended solids is being conducted by sampling with an in-line filtration system. The suspended particle density analysis will be performed by filtering approximately 1000 gallons of water through a yarn wound filter in order to collect at least 1 gram of suspended sediment. Additionally, we plan to develop a method to evaluate the affect of wind on water flow and to evaluate the use of the acoustic Doppler meters for measuring flow in the Everglades. We expect to find important correlations between the variables under study that will allow us to model and understand the relationship between water flow and the creation and preservation of tree islands. The overall goal of this study is to determine the importance of water flow in the formation and preservation of tree islands in the Florida Everglades. In the process we intend to measure suspended sediment properties and develop methods for measuring water velocity in the unique environments of the Everglades. • Water velocity measurements along the transects varied between less than 1 cm/s to more than 4 cm/s. The highest velocities occurred at those stations where there is an opening (due to sawgrass die-off) in transects 1 and 3. Relatively high velocities are observed inside the tree line in the areas closer to the head of the island. Low velocities were recorded inside the tree line at the tail of the island (Figure 1). • Wind velocity and direction are highly variable. Water flow is shielded from wind influences inside the tree line at transects 1 and 2 but not at transect 3 (Figure 2). • Water depth was variable in all transects but there is a clear tendency for water depth to decrease as the center of the island is approached in transects 1 and 2. This tendency was not observed for transect 3. • Turbidity was relatively low along all 3 transects with most values being in the 0.45 NTUs to 0.55 NTUs range (Figure 2). • The particle size distribution of most samples was exponential in nature with the largest number of particles having a smaller average diameter. Mean particle size was relatively constant, varying from 2.5 to 4.0 microns(Figure 3). • Total suspended solids were measured at 7 stations at transect 1 using an in- line filtration system. Total suspended solids were in the order of 1.0 mg/L and were relatively constant between stations. As expected, most of the total suspended solids were volatile due to the high organic content of suspended solids in a marsh environment (Figure 4). • The fact that transects 1 and 2 have hard wood tree cover that does not allow underwater vegetation to grow, appears to play a major role in the relatively rapid flow in areas with dense tree cover. Although water flow is obstructed under the canopy due to the presence of tree trunks, roots, and ferns, water is generally canalized around these obstructions. In contrast, water velocities are relatively low inside the tree line at transect 3, which is located at the tail of the tree island. In the tail the trees are sparser and do not significantly impede light penetration towards the water, thereby permitting underwater vegetation to flourish. This underwater vegetation impedes flow thereby decreasing water velocities in this area. • The Acoustic Doppler Velocity Meters work by generating a narrow beam of sound. The sound is then reflected by particulate matter suspended in the water. The equipment then measures the frequency change of the received signal and calculates the water velocity. Unfortunately the amount of suspended solids in the Shark Valley Slough is so low that the measurements have not been reliable unless suspended solids are added by stirring the bottom or by adding particulates to the water (Figure 5). • However, it was also noted that even with acceptable values of sound to noise ratio (SNR) which is achieved by adding sediments to the water, some of the high velocity magnitudes were primarily caused by the velocity reading in the “z” direction. We believe that the high Vz values are created by the addition of sediments and the release of gases when the bottom is stirred. Some sediments settle at a high pace and this is interpreted by the equipment as the vertical component of velocity. Gas is released from the bottom and rises to the surface also at a high pace, again affecting Vz. All data have been revised and, for the sake of consistency, incorporate only the x and y components of velocity (Figure 6). • Velocity measurements were taken with a dye and a ruler in areas with dense sawgrass vegetation. The dye and ruler measurements can be made with more certainty than the acoustic Doppler measurements. Our data indicateAcoustic Doppler Velocity meter water velocities are likely being underestimated. Further testing has to be performed to confirm these preliminary findings. If it is confirmed, a different method (other than use of the Sontek Flowtracker) will have to be developed to measure water velocity in areas that are densely vegetated. Figure 2 Enlarged Area Area of Study Satin Leaf X X X Black Hammock Gumbo Limbo X - Tree Islands Under Study