Download
1 / 32
320 likes | 505 Views
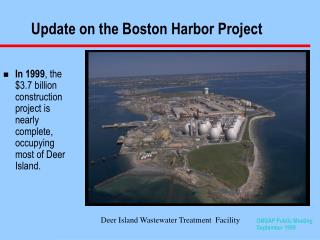
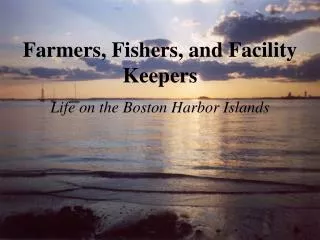
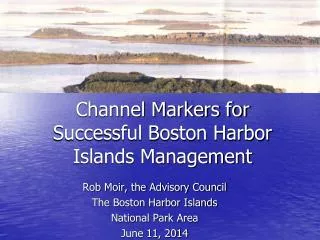
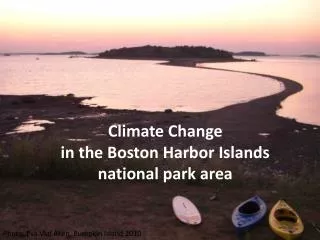
Climate Change in the Boston Harbor Islands national park area. Photo: Eva Van Aken. Bumpkin Island 2010. Boston Harbor Islands national park area . Unit I. Climate Change Science. To begin this brief video, please advance the slide to begin; then click when complete. complete .

E N D
Climate Changein the Boston Harbor Islands national park area Photo: Eva Van Aken. Bumpkin Island 2010
Unit I. Climate Change Science To begin this brief video, please advance the slide to begin; then click when complete. complete
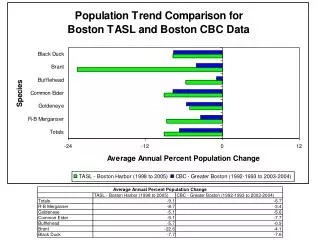
Weather vs Climate • Weather = day to day data • Climate = long term pattern Graph of precipitation in Boston Harbor. Courtesy of Kevin Morris, NETN
Climate Change is Happening • Increased temperature • air and oceans • How do we know? Photo: NASA/Goddard. Arctic sea ice reached a record minimum area in August 2012.
Not Just Warming • Changes in precipitation: droughts and flooding • More frequent, more intense storms • Increase in extreme weather events Photo: NASA Goddard/MODIS. Tropical storm Leslie and Hurricane Michael, 2012
Greenhouse Effect • This effect is necessary to support life • Caused by heat-trapping gases in the atmosphere • Human activities (burning fossil fuels, deforestation) release more gases and increase the warming effect • 93% of warming has been shown, by scientific modeling, to be because of human activity
Questions • Which of these events are evidence of climate change? • Cold winter, major snow storm, heat wave, hot decade, hurricane, increased storms • What contributes to the greenhouse effect?
Unit II. Effects of Climate Change on our Islands Photo: Mallory. Arial photo of Little Brewster and the harbor
More Weather • Increased extreme weather: flooding, nor’easters, etc • Human health threats • Loss of winter activities like skating or skiing Graph courtesy of NECIA and UCS
Erosion • Sea level rise • Increased storms and rainfall • Habitat loss Photo: Eroding cliffs on Thompson Island
Changing Species • Biome shifts • Rising temperatures drive species north or deeper • Invasives Native Rock crab Asian Shore crab
Questions • Why does the greenhouse effect increase the number and severity of storms? • What are some factors that contribute to erosion? • How does warming affect species’ habitats?
Our Carbon Footprint • Deer Island: PV panels, wind, hydroelectric • Management/facilities • Transportation
Renewable Energy Generation System Georges Island Maintenance Facility (2010) • Solar panels (32 kW ) saves $52,500 annually • Reduces use of diesel generators • Clean and sustainable energy for visitor center and food service
Inventory and Monitoring • North East Temperate Network (NETN) and other programs • Gather data now to provide a base for the future • Observe effects already happening Photo: Aya Rothwell. Scientists on Thompson Island, 2008
Questions • What are the 4 parts of the NPS Climate Change Response? • What is our park doing to reduce energy use? • How does monitoring contribute to the NPS CCRP goals?
Unit IV. What You Can Do Photo: Archibald
Leave No Trace • Pack it in, pack it out • Carry a trash bag – leave the site better than you found it • Choose reusable waterbottles and containers • Recycle and compost
Reduce Your Carbon Footprint • Conserve energy • Unplug at home, in the office, and at school • Avoid driving • Use public transit • Carpool • Make green choices • Buy efficient appliances, cars, and homes • www.climatecounts.org
Hands-On Help • Volunteer with the Stewardship program • Fight invasives • Identify and count birds • Phenology studies • Catalogue species • Citizen scientists Photo: Ranger Ray Watkins and volunteers planting beach grass on Georges Island, 2011.
Questions • What is Leave No Trace? • How can you use less energy at home? • What do volunteer stewards do on the islands?
Frame the Issue • Pick your angle • Connect to the visitor’s ‘group’ identity
A Variety Of Styles • Use metaphors and universal images
Keep it Real • Balance emotion and fact • Don’t exaggerate • Accept complexity – don’t oversimplify • Use specific data • Cite trusted sources • Scientists • The Park Service Photo: National Geographic. Mile-high dust storm in Phoenix, AZ, 2011
Don’t Overwhelm • Focus on one message • Keep the science simple • Use precise, easy vocabulary • Stay positive and action-focused
Questions • What strategies make your communication more effective? • What is your goal when interpreting climate change for visitors?
Resources/Links • NPS, Climate Change Response http://nature.nps.gov/climatechange • EPA http://www.epa.gov/climatechange • NASA http://climate.nasa.gov/ • NPCA http://staging.doyourpartparks.org/ • Blue Planet http://www.liveblueinitiative.org/ • Northeast Climate Impact Assessment http://climatechoices.org/ne/