Download
1 / 9
90 likes | 222 Views
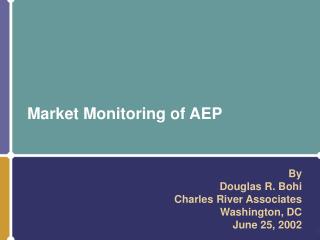
Market Monitoring of AEP. By Douglas R. Bohi Charles River Associates Washington, DC June 25, 2002. Origin and Purpose of Monitoring of AEP. Origin Requirement imposed on the merger of AEP and CSW. Interim market monitoring is required until AEP joins a FERC accepted RTO. Purpose

E N D
Market Monitoring of AEP By Douglas R. Bohi Charles River Associates Washington, DC June 25, 2002
Origin and Purpose of Monitoring of AEP • Origin • Requirement imposed on the merger of AEP and CSW. • Interim market monitoring is required until AEP joins a FERC accepted RTO. • Purpose • To determine whether AEP creates transmission congestion in order to limit competition in the wholesale market. • Respond to complaints and requests for additional studies.
Measures of Transmission Congestion • TLRs, with special attention to periods when curtailments of existing service occur. • Refusals of new service.
How does AEP transmission access compare with others? Comparative Refusal Rates of AEP East and Other Transmission Customers June 15, 2000 to June 14, 2002 Ratio of Refusals to the sum of Refused and Confirmed (%) From/To CPL DUKE TVA VAP AEP East Hourly Refusal Rate 0.6 5.1 0.3 3.3 Daily Refusal Rate 32.4 47.2 39.5 37.9 Both 8.6 15.7 7.1 12.9 Other Transmission Customers Hourly Refusal Rate 3.2 6.5 1.5 5.9 Daily Refusal Rate 80.4 74.0 86.8 61.7 Both 61.7 41.4 35.2 24.4 Ratio of Refusals to the sum of Refused, Confirmed, Retracted, and Withdrawn (%) From/To CPL DUKE TVA VAP AEP East Hourly Refusal Rate 0.6 5.1 0.3 3.3 Daily Refusal Rate 23.4 33.7 26.7 29.3 Both 7.8 14.2 6.5 11.9 Other Transmission Customers Hourly Refusal Rate 3.2 6.1 1.4 5.7 Daily Refusal Rate 35.2 31.6 44.7 34.4 Both 31.2 24.0 25.1 18.9 Source: AEP East OASIS Website.
AEP wholesale prices in markets affected by congestion. • Do they rise when flowgates are congested? • Do they rise more than market hub indexes (from Power Markets Week). • Identify specific time periods for further examination.
Effect of AEP generation dispatch on congestion • Use generation shift response factors (GSRFs) to measure the contribution of each generating unit to congestion. • Correlate rank order of operating rates by unit to rank order of GSRFs during periods of congestion. • Is the rank order of operating rates consistent with economic merit order?
Effect of transmission outages on congestion • Are there outages that coincide with periods of congestion? • Are the outages that do coincide important to congestion (using outage transfer distribution factors)?
Response to complaints or requests for additional studies. • None