Download
1 / 13
130 likes | 229 Views
Explore potential revisions to improve AQRV assessment for federal land managers. Learn about reasons, processes, and considerations for revisions, visibility analysis, threshold values, and deposition analysis. Contact John Bunyak for questions.

E N D
FEDERAL LAND MANAGERS’ AQRV WORKGROUP (FLAG): Potential Improvements and RevisionsWESTAR Fall Business MeetingSeptember 27, 2006 John Bunyak National Park Service
Reasons for Revisions • FLAG 2000—A useful tool; intended to be a working document and revised as necessary • FLMs have gained knowledge on how to better assess impacts on AQRVs • New regulatory developments over past seven years (e.g., BART rule) • Input from applicants and permitting authorities suggest both technical and policy changes are warranted (e.g., WESTAR NSR Recommendation #6) • FLMs need to clarify use of threshold values (e.g., use as benchmark as opposed to bright line for adverse impact) • Not a “comprehensive” revision, but instead we focus on the visibility analysis, the deposition levels, and the factors FLMs will consider in their decision-making process.
Process for Revisions • Seek input from States/EPA/professional groups • AWMA Specialty Conference in April 2006 • Consult with States (WESTAR/STAPPA/ALAPCO) • Consult with EPA • Announce Availability of draft revised report in Federal Register; solicit public comments • Conduct Public Meeting (if sufficient interest) • Respond to Public comments • Release Final Revised Report
Existing FLAG Haze-like Analysis • Run CALPUFF (3 years MM data) • Concentrations of SO4 & NO3 • Calculate a visibility index – bext • 24-hour average • Hour-by-hour bext using hourly f(RH) concentration (98% rollback) • Compare change in bext against annual average natural conditions • Use maximum modeled values
Existing FLAG Haze-like thresholds • < 5% change – ok • > 5% < 10% change cumulative analysis • If cumulative > 10% and source > 0.4% likely to object • > 10% likely to object
Potential FLAG Visibility Changes • Initial Screen: Q/D ≤ 10 • Use monthly average f(RH) • 98th percentile 5% Δbext (i.e. 8th high) • Any 1 year fails test • Two tiered test • Against 20% best natural conditions • Against annual average natural conditions • If fail test look at context and mitigation, then refined analysis (if necessary) • Adverse impact determination process more explicit; considers regulatory and contextual factors
Visibility Analysis Process for Distant/Multi-Source Application Presumptive No Adverse Impact Q/D ≤ 10 Y Possible Adverse Impact- Refer to FLM For Decision N ∆bext<5% (wrt best NC) Y Y N N Context/Refined Analysis Alleviates Concerns? ∆bext<5% (wrt annual NC) W.O.E. Alleviate Concerns? Y N Y N
What Does “Weight of Evidence” (W.O.E.) Mean? • If here you have failed the 20% best natural condition test, but passed the annual natural condition test • If BACT in question, or multiple Class I areas impacted, or if State using 20% best background in its BART analysis, may jump to context, mitigation, further analysis • In many cases, with resolution of BACT, probably pass without further analysis
Further Considerations • Regulatory Factors • Geographic extent, intensity, duration, frequency, time of visitor use, natural conditions that affect visibility • Contextual Considerations • Current pollutant concentrations and AQRV impacts in the Class I area • Air Quality trends in the Class I area • Emission offsets obtained or other mitigation offered by the permit applicant • Enforceable emission changes that have occurred or would occur before source operation date • Whether there are approved SIPs that account for new source growth and demonstrate “reasonable progress” toward visibility goals • Expected life of the source • Stringency of proposed emission limits (BACT?) • Ancillary environmental benefits proposed by applicant (e.g., reduced toxics emissions, pollution prevention investments, CO2 sequestration, purchase of “green” power • Comments from the public and other agencies
Further Considerations (cont) • Mitigation strategies • Emission offsets • Emission rate reductions • Monitoring/special studies leading to future permit revision (monitoring alone NOT a mitigation strategy) • Results of refined analysis (if necessary)
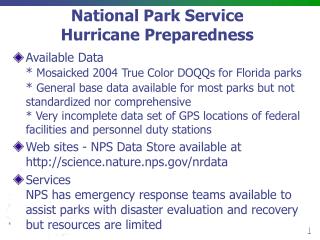
Deposition Analysis • Included concern thresholds, pollutant exposures, and deposition analysis thresholds (DATs) for sulfur and nitrogen deposition • Expanded discussion of “Critical Loads” to reflect developments since FLAG 2000 • FLMs will consult with States in developing policy approaches (WESTAR NSR Recommendation #7) • Replaced dated deposition maps with reference to NADP website for current trends data • Replaced old deposition data with links to agency websites
Ozone • Updated ozone sensitive species lists, but replaced the lists with links to agency websites to help keep info more current • Deleted old/outdated W126 and N100 ozone data
FLAG Questions?? • Contact John Bunyak at (303-969-2818) or john_bunyak@nps.gov