Download
1 / 25
250 likes | 392 Views
OPTIMISING THE SOCIO-ECONOMIC OUTCOMES UNDER THE MURRAY-DARLING BASIN PLAN – Water Policies and Programs Presentation to ABARES Outlook Conference, Canberra 2 March 2011 by Tony Slatyer, Water Reform Division. The Government’s objectives.

E N D
OPTIMISING THE SOCIO-ECONOMIC OUTCOMES UNDER THE MURRAY-DARLING BASIN PLAN – Water Policies and Programs Presentation to ABARES Outlook Conference, Canberra 2 March 2011 by Tony Slatyer, Water Reform Division
The Government’s objectives • “They key challenge before the Parliament is for this to be a term in which action is taken across the Basin to restore the system to health. We need to do this in a way which delivers three core outcomes: • healthy rivers • strong communities • food production” Minister for Sustainability, Environment, Water, Population and Communities, 25 October 2010
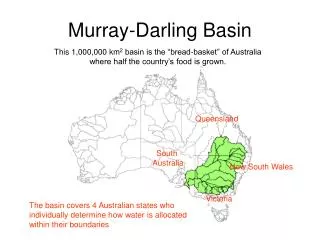
The broad policy context • Water resource constraints • Environmental decline • Climate uncertainty • Socio-economic factors
Resource constraints: the effect of drought on Victorian Murray and Goulburn system allocations
Resource constraints: the effect of drought on Murrumbidgee River Valley allocations
River regulation and water diversions have resulted in: doubling of the average period between environmentally beneficial flooding of the major floodplain and wetland systems (to at least 3.5 years) average period between the flood events, which are required to flush the Murray river mouth, has increased from 1.2 years to 2.2 years Environmental decline
The scale of environmental decline • 20 out of 23 catchments rated poor to extremely poor • Source: MDBA Sustainable Rivers Audit
Economic costs of environmental decline • Reduced water quality, increasing treatment costs • Reduced scope to harvest native fish • Reduced tourism • Reduced recreation opportunities • Increased erosion and sediment accumulation • Reduced natural flood control • Risk to natural pollination services • Risk to natural pest control services
Uncertainty about climate change impacts Impact of climate change on average surface water availability CSIRO (2008) Water Availability in the Murray-Darling Basin
Climate change risks Median water availability decline = by 2030 4% reduction in average diversions under current plans 24-30% further reduction in average end of system flows “Current surface water sharing arrangements in the MDB would generally protect consumptive water users from much of the anticipated impact of climate change but offer little protection to riverine environments” CSIRO (2008) Water Availability in the Murray-Darling Basin
Socio-economic context • Basin population increasing slowly • 4.3% between 2001 and 2006, compared to an increase of 5.8% for Australia as a whole • many Basin towns have had long term population decline • Agricultural sector employment falling rapidly • down by 12.4% (2001 to 2006) while total Basin employment has increased by 8.3% in this period. • unemployment rate similar to national average • Exchange rate up by 50% (trade weighted)
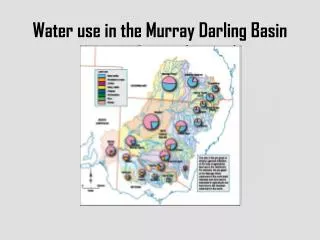
Total water use in the Basin fell in the drought from 10,500 GL (2000-01) to 3,100 GL (2007-08), while ABS has estimated the Gross Value of Irrigated Agricultural Production (GVIAP) remained steady rapid growth in water trade (6% per annum average growth in allocation trades) rapid improvement in water use efficiency (eg rice by 90 per cent and fruit by 76 per cent) (ABS Cat No. 4610, 2007-08) Socio-economic context (continued)
The policy response: the Basin Plan • Basin wide planning framework • sets the ground-rules for states based plans • considers future water availability, and all significant water uses, in setting new limits on water use in the Basin • placing water use in the Basin on a more sustainable footing • enabling people to plan for their future with greater confidence • must optimise economic, social and environmental outcomes.
The ‘optimisation’ requirement “... where a discretionary choice must be made between a number of options the decision-maker should, having considered the economic, social and environmental impacts, choose the option which optimises those outcomes” Australian Government Solicitor 2011
The policy response: ‘Bridging the Gap’ Current diversion limit Temporary Diversion Provisions (if required) Basin Plan comes into effect Water recovery to bridge the gap through water purchase and investment in water saving infrastructure Water recovery Sustainablediversionlimit
The role of the water buyback • Government purchase of water entitlements • to progressively and directly recover water for the environment • while respecting water property rights • no compulsory acquisition • As at 31 January 2011, Government has recovered entitlements that will provide 670 gigalitres (GL) of water on average, or 22 percent of a 3,000GL reduction.
The role of infrastructure programs • Infrastructure and efficiency investments of around $4.9 billion in Basin • water efficiency savings are retained for use in irrigation, as well as water being returned to the environment • includes funding for infrastructure planning
Sustainable Rural Water Use and Infrastructure Program Vic $1.103b NSW PIIOP $650m Modernisation Planning $5m SA PIP $110m SA $420M Hot-spots $23m other QLD $160m On-Farm IrrigationEfficiency $300m Strengthening Basin Communities $200m NSW $708m ACT $85m
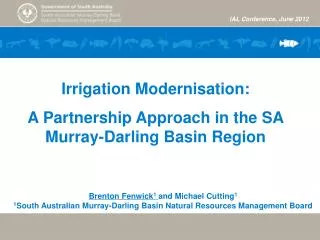
Examples of SRWUIP investments to date • First round of the On-farm Irrigation Efficiency Program • ~$33M to Murray Irrigation Limited • ~$24M to Ricegrowers Association of Australia • ~$26M to Goulburn Broken CMA • ~$12M to Australian Processing Tomato Research Council Inc • ~$4M to Lachlan CMA • ~$1.5M to SA Murray-Darling Basin Natural Resources Management Board • Total $100M • Round 2 round is open now and closes in March 2011
Examples of investments to date (continued) Private Irrigation Infrastructure Operators Program in NSW (PIIOP) Round 1 grants: ~$51M to Coleambally Irrigation ~$50M to Murrumbidgee Irrigation ~$9.5M to Marthaguy Irrigation Scheme ~$37.5M to Tenandra Scheme ~$115M to Trangie-Nevertire Irrigation Scheme Total $263M Round 2 opened 18 February 2011
Policy response: other reforms • Market opening reforms • transparency • consistency • trading rules • National Water Market Common Registry System • Water information reforms • BOM Water data
Net impact of reforms • Will depend on the size of the ‘gap’ and the final location, type and sale of infrastructure investments • Effects if a 3,500 GL SDL scenario occurs, and Water for the Future investment, based on current infrastructure investment proposals: Note: Effect of SDLs with and without Government water recovery actions – change from baseline (no SDLs) in per cent for the whole Basin in 2018
Net impact of reforms • Forecast of economic growth (GRP) in the Basin under a 3,500 GL reduction scenario From ABARES study
In summary: • To ensure sustainable water use into the future, there will be new limits on water use in the Murray Darling Basin. • In deciding these limits, the MDBA must optimise social, economic and environmental considerations. • The Commonwealth’s Water for the Future policies programs aim to assist irrigation communities to adjust to these changes, with: • buybacks to protect remaining entitlement holder from reductions • infrastructure investment to improve water use efficiency; • funds to assist local governments to improve local water security • market opening • water information reforms