Download
1 / 28
280 likes | 399 Views
This paper discusses the challenges of identifying split failures due to demand surpassing capacity (over-saturation) in traffic signal systems. It emphasizes the need for effective tools to monitor performance metrics continuously. Key topics include defining saturation, quantifying it using the Yauch v/c ratio, and collecting data for informed decision-making. Insights from studies in Indianapolis reveal split inefficiencies, providing a framework for adjustments without extensive field visits. The goal is to develop accurate data collection methodologies and improve response strategies during saturation events.

E N D
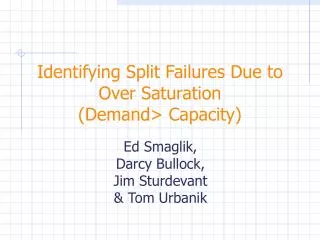
Identifying Split Failures Due to Over Saturation (Demand> Capacity) Ed Smaglik, Darcy Bullock,Jim Sturdevant & Tom Urbanik
Prevailing View • A signal phase does not have periods of over saturation if an agency never sees or hears about problems. We need tools to tabulate performance metrics related to over saturation 24-7!
Outline • What is saturation? • How do we quantify it? • Yauch v/c ratio • How can we measure it? • Fuhr’s . collect data for better information.. • How should we look at it? • What can we do?
Split reduction to improve efficiency Under saturated split with slack
Unmet demand at termination Saturated split with no slack
Need served volume available in real time v/c ratio • Ex.. 30s green on 60s cycle • Sat flow is 1800 vphpl • Observed flow on green/amber is 16 • v/c= 1.06 • … no slack green there • Served vs. Demand Issue
Split Failure? Noblesville site, October 18th, 2004 v/c plots
+5s -5s Split reallocation October 26th October 18th Phase 5 Phase 6
Can we infer Split Failures by estimating served volume to capacity ratios?
Comments • Before we can manage during over saturation, we need to: • Figure out what we are going to measure • Determine how we can pull some meaningful information out of data • Short term goal: develop tools to enable small, strategic human-in-the-loop to adjustments…without extensive field visits.
Challenges • High Quality Cycle by Cycle Count Data • Detection Technology • Collection on Controller • Quickly extracting meaningful easily understood graphs
Questions? Do we mess with PCEs?
NC1234C EA1234C
Video Detection – Noblesville, IN:Data Collection Cabinet A – Remote Windows Computer for Data Collection B – Video Multi-plexer C – Camera Detector Cards D – Loop Detector Cards E – Patch Panel