Download
1 / 1
10 likes | 131 Views
(a). (c). 2 z 0. R. R 0. 2 ω 0. (b). 200. 100. 0. 50. Critical Adsorption on Nanoparticles . Ashis Mukhopadhyay, Wayne State University, Detroit, MI.

E N D
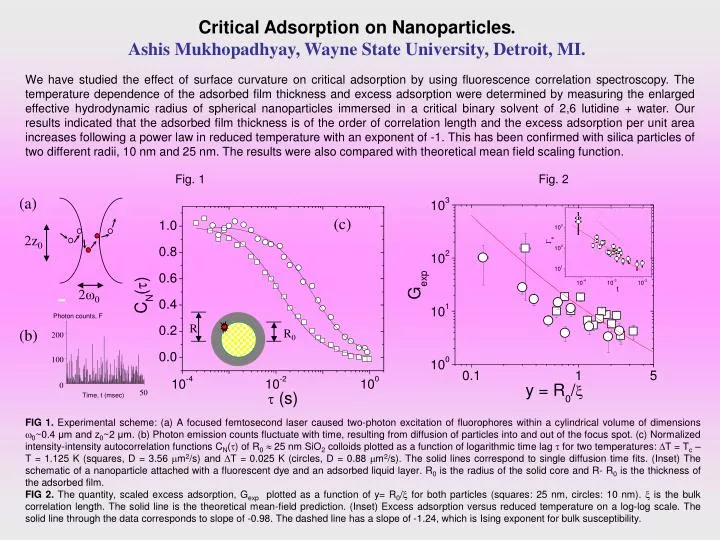
(a) (c) 2z0 R R0 2ω0 (b) 200 100 0 50 Critical Adsorption on Nanoparticles. Ashis Mukhopadhyay, Wayne State University, Detroit, MI. We have studied the effect of surface curvature on critical adsorption by using fluorescence correlation spectroscopy. The temperature dependence of the adsorbed film thickness and excess adsorption were determined by measuring the enlarged effective hydrodynamic radius of spherical nanoparticles immersed in a critical binary solvent of 2,6 lutidine + water. Our results indicated that the adsorbed film thickness is of the order of correlation length and the excess adsorption per unit area increases following a power law in reduced temperature with an exponent of -1. This has been confirmed with silica particles of two different radii, 10 nm and 25 nm. The results were also compared with theoretical mean field scaling function. Fig. 1 Fig. 2 FIG 1. Experimental scheme: (a) A focused femtosecond laser caused two-photon excitation of fluorophores within a cylindrical volume of dimensions 0~0.4 μm and z0~2 μm. (b) Photon emission counts fluctuate with time, resulting from diffusion of particles into and out of the focus spot. (c) Normalized intensity-intensity autocorrelation functions CN() of R0 25 nm SiO2 colloids plotted as a function of logarithmic time lag for two temperatures: T = Tc – T = 1.125 K (squares, D = 3.56 m2/s) and T = 0.025 K (circles, D = 0.88 m2/s). The solid lines correspond to single diffusion time fits. (Inset) The schematic of a nanoparticle attached with a fluorescent dye and an adsorbed liquid layer. R0 is the radius of the solid core and R- R0 is the thickness of the adsorbed film. FIG 2. The quantity, scaled excess adsorption, Gexp plotted as a function of y= R0/ for both particles (squares: 25 nm, circles: 10 nm). is the bulk correlation length. The solid line is the theoretical mean-field prediction. (Inset) Excess adsorption versus reduced temperature on a log-log scale. The solid line through the data corresponds to slope of -0.98. The dashed line has a slope of -1.24, which is Ising exponent for bulk susceptibility.