Download
1 / 106
1.06k likes | 1.24k Views
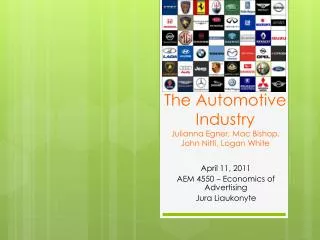
The Automotive Industry Julianna Egner , Mac Bishop, John Nitti, Logan White. April 11, 2011 AEM 4550 – Economics of Advertising Jura Liaukonyte. Agenda. Industry Analysis Advertising Analysis For Dealerships For Brands Advertising Strategies Recalls & Brand Reputation

E N D
The Automotive IndustryJuliannaEgner, Mac Bishop, John Nitti, Logan White April 11, 2011 AEM 4550 – Economics of Advertising Jura Liaukonyte
Agenda • Industry Analysis • Advertising Analysis • For Dealerships • For Brands • Advertising Strategies • Recalls & Brand Reputation • Recent Advertising Innovations • Investment & Advertising Recommendations
Why the Automotive Industry? • Automobile industry a staple of the U.S. economy • Americans have developed a deeply patriotic connection to this auto manufacturing tradition • Over $100 billion in revenue in 2010 • Industry expected to grow • Billions of $ spent on advertising every year • Health of the industry impacts nationwide advertising
Industry Definition • Sub-divided Industry: • Car and Automobile Manufacturing - Companies that manufacture car and automobile chassis • Light Truck and Sport Utility Vehicle Mfg. – Companies that manufacture light trucks and utility vehicles, such as vans, pick up trucks, and sport-utility vehicles • Produce vehicles in assembly plants
Major Products and Services • Compact and subcompact sedans • Luxury Cars • Mid-size and full-size sedans • Sports cars
Major Products and Services • CUVs (crossover vehicle) • Large Pickup Trucks • Small Pickup Trucks • Large Vans • Small Vans • SUVs
Current Industry Condition • Recession brings trouble for the big three: Ford, Chrysler, GM • Bankruptcy • Restructuring • Large losses or dismal profits • Reasons • Reliance on SUVs and larger cars
Signs of Relief • In 2011, industry profit margins will be relatively healthy at 2.0% • Car industry revenue to grow at an estimated rate of 4.2% annually to $102.3 billion by 2016 • Shifting consumer preferences • General recovery in demand • Improving consumer sentiment • Credit availability is recovering
Why People Buy? • Past: All about price • Current: Price, running cost, environmental effects • Motor vehicle affordability on the rise • Green revolution • Consumers will continue to demand environmentally friendly cars • Price of gas will rise in 2011
Distribution Model < Car & Automobile Light Truck and SUV >
International Influence • Imports represent 51.0% of domestic demand for automobiles • Exports generate 19.1% of industry revenue
Operating Conditions • Technology • Design, Innovation (hybrid, plug-in hybrid electric vehicles ) Engineering, and Production method • Most auto manufactures are working on a hybrid or plug-in electric • Regulation and Policy • The Government compiles complaints from consumers and will prod a manufacturer to recall a vehicle if warranted. • Obama administration – efficiency mandate • Cars - Average 39 mpg • Light trucks - Average 30 mpg
Competitive Landscape • 174 total companies as of 2007 • HHI for top 50 firms=1448.8 • Car CR4 = 55.6 • Light Truck/SUV CR4 = 73.5
Industry Structure • Market Concentration: Medium • Competition in Industry: Medium • Barriers to Entry: High • Competitive differentiation: • Price • Quality • Efficiency • Supply-chain integration • Industrial relations • Types of cars manufactured • Product innovation
Global Competition • Finding an efficient business model to operate in this globalized industry environment is key. • Example: • One Ford: streamlined design and manufacturing platform across Ford’s global markets • GM’s joint venture with China’s Shanghai Automotive Industry Corporation
Competitor Highlights • Toyota: • 2009 – 2010: U.S. market share fell from 19.5% to 16.8% • Panicked and angry car buyers opted to purchase cars from other companies • Toyota Prius first mass-produced hybrid gasoline-electric car – major success for Toyota. • Toyota Motors is world's largest automotive manufacturer (overtaking GM in 2008) • GM • 2006 – 2011: U.S car sales fell at a troubling 10.3% annualized rate • Total U.S. car sales fell 4.3% annually
Competitor Highlights • Ford • CEO restructuring the company’s business practices since 2006 • Put Ford in a better position when the recession hit. • “One Ford” initiative has helped Ford share designs and other efforts across global divisions • Honda • Notable for its unusually high spending on research-and-development (R&D) • Equivalent to about 5% of revenue • Competitive in hybrid market – Honda Insight • Did not achieve the commercial success of the rival Toyota Prius. • Hyundai • Second largest Asian automaker • Sales rose 7.2% annually since 2006 while the U.S. market decreased 4.3% annually • Have kept prices low while radically improving vehicle design
Brand EquityBrand Values from Interbrand’sBest Global Brands 2010
Advertising-to-Sales 2010: • Revenues = $76,664 for cars, $94766 for light trucks = $171.43 billion • $13 billion spent on advertising = 7.6 Ad-to-sales ratio • Medium A-S-R • Highest: Liquor (15.6%)
Organization • Integrated supply chain • Design • Engineer • Manufacture many of the components and parts • Market • Sell • Supply network: steel, raw materials, other components
Overview • Many different advertising strategies in their ad campaigns • Informative • Combative • Persuasive • Celebrity Endorsement • Emotional Appeal • $13 billion spent on advertising in 2010 • Advertising spending is expected to persist at 2.2% of revenue in 2011
Auto Industry Advertising • 2 layers to advertising in the auto industry • Advertising by dealerships • Advertising by brands Brands Dealerships Nationwide Local High Quality Lower Quality Informative Persuasive Establish Personal relationship Combative
Dealership Advertising • Dealership Advertising • Primarily informative in nature • Demand is more price elastic • Ads are more focused on price than car attributes • Ads are almost always local and usually feature the boss of the dealership— “personal connection” • Ads are lower in quality and much less expensive to produce • Often loud, repetitive, and low quality • Notable slogan: “No Hassle, No Razzle Dazzle” from a local Ithaca dealership
Dealership Ads • http://www.youtube.com/watch?v=A82AmZ3Glmk
Dealership Advertising Trends • Dealership advertisements reflect consumer preferences in local area • Consumer preferences influenced • Climate • Income • Reason for purchase (car use) • Car culture of city • Data on dealership advertising 2008-2010 • Sub-sample of different markets nationwide • Associations between brands and cities, etc.
Dealership Advertising by City Top advertised brands by market
Normalized Dealership Adv.Highest Total Dealership Spending by City
Ford F-SeriesTotal dealership advertising spending for the F-Series by city
BMW 3-SeriesTotal dealership advertising spending for the 3-Series by city
Advertising Spending by City • Top Spender: Los Angeles • Total spent by dealerships 2008-2010 = $102,669,540 • Why? • 17.8 million people in metropolitan area • Extremely strong car culture – revolutionary highway system, mediocre mass transit • Cars crucial to livelihood in the city • Highest income disparity but extreme wealth in the area
Brand Advertising • Brand Advertising • More persuasive in nature • Demand is more price inelastic • Ads are more focused on car attributes than price • Ads are typically national or regional, covering a much larger area than dealership ads • Ads are higher in quality and much more expensive to produce and air
Total Ad Spending • Auto industry “Big Three” top spenders on advertising: • Ford – 18% • GM – 18% • Chrysler – 12% • Biggest advertising threats: • Toyota – 12% • Nissan – 11% • Honda – 9%
Average Ad Spending by BrandVolkswagen highest spender = $167,510 per ad
Average Ad Spending by Brand • Highest spenders per ad: • Volkswagen • Ford • Nissan • Honda • Hyundai • Implications • Primarily foreign automakers • Trying to win larger part of the market • Buying more expensive ad spots, large audiences • Foreign brands higher reputations recently
Brand Ad Spending Trends • Ford Fusion – Gas powered or Hybrid • Emphasis on Fuel Efficiency • “We Speak Value. We Speak MPG” • GM – Chevrolet Malibu • Gas powered, but fuel efficient – 33 MPG • “Fuel economy that a comparable Toyota Camry can’t match”
Brand Ad Spending Trends • Honda Accord – Honda’s bestseller • Honda Insight – Honda’s hybrid • Lower starting price than Prius ($18,200 v. $23,050) • Toyota Prius – Put hybrid vehicles on the map • “Harmony between man, nature and machine” • Toyota Corolla – Comparable to the Honda Accord
Brand Ad Spending Trends *Sunday Early Fringe = 6pm *Prime Access 1 = 7pm (post evening news) *Late news = 11pm
Implications • Sunday highest ad spending by brands – Why? • Sporting events • Awards shows • Largest audience – home with family, etc. • Time of day with highest ad spending: • Sunday Fringe 2 – ends of sporting events, etc. • Prime Access 1 – Post evening news, entertainment television, game shows • Late News – Post sitcoms, dramas
Advertising by Program Type • Program type with highest average cost: • Professional Football – Game • Professional Football – Post-Game • Award/Pageant/Parade/Celebration • Primarily air on Sundays • Fits with data on time of day spending • Highest ad spending Sunday Fringe 2 • Sundays around 6pm • Coincides with end of games and beginning of post-games
Where Brands Advertise • BMW – 79% advertising during Golf • Mercedes – 15% advertising during Golf • 14% during News Forum/Interview shows • GM – 45% advertising during college and professional sporting events • Toyota – 21% advertising during drama shows • 15% during Professional Football Games • Conclusion: Luxury brands advertise to target educated consumers of higher socio-economic status
Brand Informative Advertising • Conveys simple search attributes to consumers • Consumers look for product specs and special features when making purchasing decisions • Automotive Industry: • Fuel efficiency • Technical features – engine size, horsepower, etc. • Price point • Available financing