Download
1 / 23
230 likes | 370 Views
Statistical Analysis related to the Inverse problem. Se Hee Kim and Lingsong Zhang SAMSI/CRSC Undergraduate Workshop. Review of the Inverse problem. What we get Displacement y i and time t i Spring model Target: Estimate C and K based on the observed y i.

E N D
Statistical Analysis related to the Inverse problem Se Hee Kim and Lingsong Zhang SAMSI/CRSC Undergraduate Workshop
Review of the Inverse problem • What we get • Displacement yi and time ti • Spring model • Target: Estimate C and K based on the observed yi SAMSI/CRSC 2006
Review of the Inverse Problem (cont.) • Estimation procedure • Minimize the cost function • Guess initial values of C and K • Using optimization method and differential equations to find the values of C and K which minimize the above cost function. • inv_beam.m SAMSI/CRSC 2006
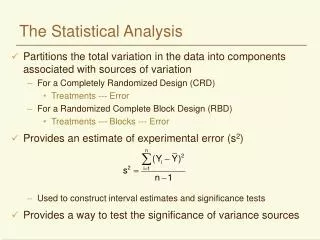
Underlying Statistical Models • yi has measurement error • The above model can be viewed as a regression model where are iid (independent identically distributed) from N(0, 2). • Estimating C and K leads to the procedure mentioned earlier (will show later) SAMSI/CRSC 2006
Nonlinear regression • Linear • Linear is for the parameter(s) • Nonliner • y(ti, C, K ) are defined by an ODE, it is not from a simple linear function of C and K • A regression model is called nonlinear, if the derivatives of the model with respect to the model parameters depend on one or more parameters SAMSI/CRSC 2006
Nonlinear regression • A regression model is not necessarily nonlinear if the graphed regression trend is curved • Example: • Take derivatives of y with respect to the parameters 0, 1 and 2: • None of these derivatives depend on a model parameters, thus the model is linear. SAMSI/CRSC 2006
Nonlinear regression • The general form of a nonlinear regression model is • Where x is a vector of explanatory variables, is a vector of unknown parameters and is a N(0, 2) error term • To estimate unknown parameters, SAMSI/CRSC 2006
Statistical problems • How to evaluate the estimation of C and K? • Estimation of . • Variation of the and . • Are those assumptions correct? • Measurement errors are truly from iid Normal distribution? • Are there better models? SAMSI/CRSC 2006
Estimation of • If all model assumptions hold • we have Use these to estimate Our data set gives YOURS? estimateofsigma.m SAMSI/CRSC 2006
Evaluate the Estimation of C and K • Method 1- repeating experiments • Independent experiments under the same conditions • How many experiments required? we will use 8 sets of data to illustrate this method • Use simple univariate statistics of C’s and K’s to evaluate the performance of estimation. SAMSI/CRSC 2006
Examples • 8 sets of data from the same conditions • Get the estimations of C and K • Variations of C and K sd(C)= .2675 sd(K)=4.3437 SAMSI/CRSC 2006
Examples • 8 sets of data from the same conditions • Get the estimations of C and K • Variations of C and K sd(C)= .2675 sd(K)=4.3437 After removing the “outlier” sd(C)=.0937, sd(K)=2.4828 SAMSI/CRSC 2006
Exercise • To get the standard deviations from your 10 data sets (std) • If you do not have the record of estimations, • Use inv_beam_all.m to get Cvec, Kvec, (it will take a long time, do it during the break) • If you have the record of the estimations • Input them into Cvec and Kvec, • Bar-chart? • Try barCvec.m and barKvec.m (need to adjust some numbers) SAMSI/CRSC 2006
Evaluate the Estimation (cont.) • Method 2 - Using the nonlinear regression model to evaluate the estimation of C and K. • How to get the standard deviation (or variance) of and ? Use the covariance matrix of SAMSI/CRSC 2006
Recall: Linear Regression • Simple Linear Model: • The model we estimate the covariance matrix of 0 and 1 using where SAMSI/CRSC 2006
Apply to the inverse problem Our model we will have similar result where the standard errors of and are square roots of the diagonal elements of SAMSI/CRSC 2006
Checking the Assumptions • Check whether the residuals are iid Normal noise • Independent? • Residual plot vs Time • Variance are constant? • Residual plot vs. fitted values • Residuals are Normally distributed? • Normal Quantile-Quantile plot SAMSI/CRSC 2006
Checking dependency SAMSI/CRSC 2006
Checking Constant Variance SAMSI/CRSC 2006
Checking Normality SAMSI/CRSC 2006
Other models? • Is the spring model appropriate for our data? • Residual shows dependent structure • It seems that variances are not equal • Normal assumption might not hold • Other statistical inference method? • Same underlying model, but different assumptions • Other statistical models to fit the data • Some alternative physical models for our data? SAMSI/CRSC 2006