Survival Outcomes in Neoadjuvant and Adjuvant Treatments: Kaplan-Meier Analysis
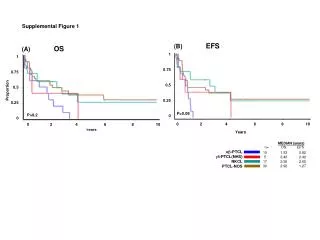
This figure presents Kaplan-Meier estimates of survival curves for patients undergoing various randomized trials of neoadjuvant and adjuvant treatments. The curves depict overall survival and progression-free survival rates across different treatment groups, including FFCD/RT with adjuvant chemotherapy and various EORTC combinations. The data illustrates key differences in survival outcomes, helping to inform clinical decision-making for treatment sequences in cancer therapy.

Survival Outcomes in Neoadjuvant and Adjuvant Treatments: Kaplan-Meier Analysis
E N D
Presentation Transcript
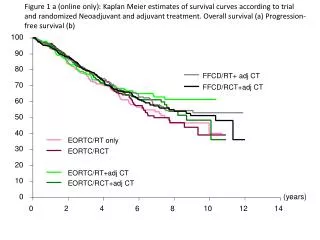
Figure 1 a (online only): Kaplan Meier estimates of survival curves according to trial and randomized Neoadjuvant and adjuvant treatment. Overall survival (a) Progression-free survival (b) 100 90 80 FFCD/RT+ adj CT 70 FFCD/RCT+adj CT 60 50 40 EORTC/RT only 30 EORTC/RCT 20 EORTC/RT+adj CT 10 EORTC/RCT+adj CT 0 (years) 0 2 4 6 8 10 12 14
Figure 1 b (online only): Kaplan Meier estimates of survival curves according to trial and randomized Neoadjuvant and adjuvant treatment. Overall survival (a) Progression-free survival (b) 100 90 80 FFCD/RT+ adj CT 70 FFCD/RCT+adj CT 60 50 40 EORTC/RT only 30 EORTC/RCT 20 EORTC/RT+adj CT 10 EORTC/RCT+adj CT 0 (years) 0 2 4 6 8 10 12 14