Download

1 / 31
310 likes | 426 Views
INEQUALITY. Principles of Microeconomics Fall 2010 David F. Ruccio. Source: a nalysis of U.S. Census Bureau data in Economic Policy Institute, The State of Working America 1994-95 (M.E. Sharpe: 1994), 37.

E N D
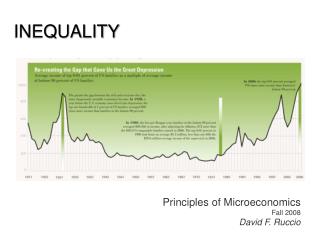
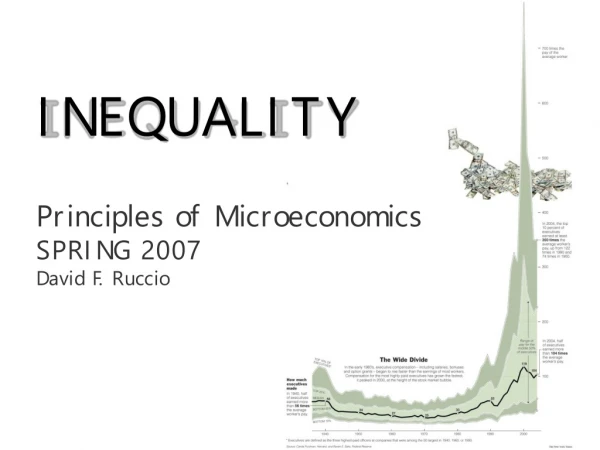
INEQUALITY Principles of MicroeconomicsFall 2010David F. Ruccio
Source: analysis of U.S. Census Bureau data in Economic Policy Institute, The State of Working America 1994-95 (M.E. Sharpe: 1994), 37
Source: Congressional Budget Office, “Average Household After-Tax Income,” Data on the Distribution of Federal Taxes and Household Income, April, 2009.
The CBO data show that between 1979 and 2006: • The average after-tax income of the top one percent of the population more than doubled, rising from $337,100 to $1,200,300, for a total increase of $863,200, or 256 percent. (CBO adjusted these figures for inflation and expressed them in 2006 dollars.) • By contrast, the average after-tax income of the middle fifth of the population rose a relatively modest 21percent, or $9,200, reaching $52,100 in 2006. • The average after-tax income of the poorest fifth of the population rose just 11 percent, or $1600, over that period. • The top one percent of the population received 16.3 percent of national after-tax income in 2006, up from its already-large 7.5 percent share in 1979. • In contrast, the shares of national income received by various groups of low- and middle-income people all fell. The middle fifth of the population received 16.5 percent of the national after-tax income in 1979, but only 14.3 percent in 2006. The bottom fifth received 6.8 percent of such income in 1979, but just 4.7 percent in 2006.
Source: Thomas Piketty and Emmanuel Saez, “Income Inequality in the United States, 1913-1998,” Quarterly Journal of Economics, 118 (1), 2003. Updated to 2007 at http://emlab.berkeley.edu/users/saez.
Source: Congressional Budget Office, “Data on the Distribution of Federal Taxes and Household Income” (April 2009)
Change in Real Hourly Wages for Men by Wage Percentile, 1973-2004 Source: Jared Bernstein, “The 21st Century Workplace” (27 May 2005)
Average Executive to Average Production Worker Pay Ratio, 1990-2005 Sources: Total executive compensation: Business Week annual compensation survey, various issues, 1991-2005. Includes: salary, bonus, restricted stock, payouts on other long-term incentives, and the value of options exercised. Average worker pay: BLS, Employment, Hours, and Earnings from the Current Employment Statistics Survey, Table B-2
Cumulative Percent Change in Economic Indicators, 1990-2005 (in 2005 dollars) CEO Pay 298.2% S&P 260.8% Profits 106.7% Worker Pay 004.3% Minimum Wage -009.3% Sources: Total executive compensation: Business Week annual compensation survey, various issues, 1991-2005. Includes: salary, bonus, restricted stock, payouts on other long-term incentives, and the value of options exercised. S&P 500 Index: Economic Report of the President, 2005 Table B-96; 1997, 2000 Table B-93; average of daily closing index. Corporate Profits: BEA, NIPA, Table 6.16, with inventory valuation and capital consumption adjustments. Average worker pay: BLS, Employment, Hours, and Earnings from the Current Employment Statistics Survey, Table B-2. Minimum wage: Lowest mandated federal minimum wage, nominal; US Dept. of Labor, Employment Standards Administration, Wage and Hour Division. Adjustment for inflation: BLS, Average Annual CPI-U, all urban consumers, all items.
Source: United for a Fair Economy, http://www.faireconomy.org/research/CEO_Pay_charts.html
Source: Dean Baker, The Productivity to Paycheck Gap: What the Data Show (April 2007 )
“We have heard a lot about growing income inequality. There has been much less attention paid to growing inequality in life expectancy, which is really quite dramatic.” —Peter Orszag, director of the Congressional Budget Office
Source: Arthur B. Kennickell, “Ponds and Streams: Wealth and Income in the U.S., 1989 to 2007,” Federal Reserve Board Working Paper, January 7, 2009, Figure A3a, p. 63.
Source: Arthur B. Kennickell, “Ponds and Streams: Wealth and Income in the U.S., 1989 to 2007,” Federal Reserve Board Working Paper, January 7, 2009, Figure A3a, p. 63. Does not include assets held in money market mutual funds or tax-deferred retirement accounts.
In 2003, the top one percent of the population received 57.5 percent of all capital income. This was larger than in any other year examined by the CBO, with its data going back to 1979. • The flipside of this trend is that the share of capital income that is held by the rest of the population has dropped markedly. In 2003, the bottom 80 percent of the population received only 12.6 percent of such capital income, the lowest share on record (with data back to 1979). As recently as 1989, for instance, the bottom 80 percent of the population received 23.5 percent of capital income subject to taxation, a share nearly twice as high. Source: Congressional Budget Office, Historical Effective Federal Tax Rates: 1979 to 2003, December 2005
Forbes 10 Richest Americans [net worth-September 2010] 1-Bill Gates $54 billion 2-Warren Buffett $45 billion 3-Lawrence Ellison $27 billion 4-Christy Walton & family $24 billion 5-Charles Koch $21.5 billion 6-David Koch $21.5 billion 7-JimWalton $20.1 billion 8-Alice Walton $20 billion 9-S. Robson Walton $19.7 billion 10-Michael Bloomberg $18 billion
The World's Billionaires (March 2010) Name Citizenship Net Worth Residence ($billion) Carlos Slim Helú Mexico 54 Mexico William Gates III United States 53 United States Warren Buffett United States 47 United States Mukesh Ambani India 29 India Lakshmi Mittal India 29 United Kingdom Lawrence Ellison United States 28 United States Bernard Arnault France 28 France Eike Batista Brazil 27 Brazil Amancio Ortega Spain 25 Spain Karl Albrecht Germany 24 Germany
Sources: Anthony B. Atkinson, Thomas Piketty and Emmanuel Saez. Chart by Catherine Mulbrandon of VisualizingEconomics.com.
Numbers of Poor in Developing World (millions) Source: S. Chen and M. Ravallion, “The Developing World Is Poorer Than We Thought, But No Less Successful in the Fight against Poverty” (World Bank, August 2008)
Food for thought. . . George A. Akerlof (2003 interview with Der Spiegel): "What we have here is a form of looting. . .The rich don't need the money and are a lot less likely to spend it—they will primarily increase their savings. Remember that wealthier families have done extremely well in the US in the past twenty years, whereas poorer ones have done quite badly.” Paul Samuelson: "If we made an income pyramid out of a child's blocks, with each layer portraying $1,000 of income, the peak would be far higher than the Eiffel Tower, but almost all of us would be within a yard of the ground.” Mr. Spock of "Star Trek" (describing Ardana, where the rulers live in luxury in a cloud city above miners working in misery): "This troubled planet is a place of the most violent contrasts. Those that receive the rewards are totally separate from those who shoulder the burdens. It is not a wise leadership."