Download
1 / 50
580 likes | 1.08k Views
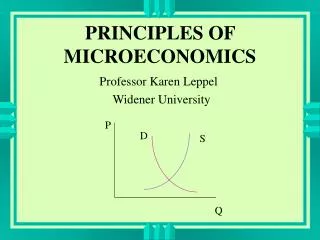
PRINCIPLES OF MICROECONOMICS. Professor Karen Leppel Widener University. P. D. S. Q. Resource Utilization. Economics : The study of the allocation of scarce resources. The Economic Problem : How do we use scarce resources to best satisfy unlimited human wants?.

E N D
PRINCIPLES OF MICROECONOMICS Professor Karen Leppel Widener University P D S Q
Economics: The study of the allocation of scarce resources. The Economic Problem:How do we use scarce resources to best satisfy unlimited human wants?
To say that a good is scarce means that less of the good is freely available than consumers would like. examples of scarce goods: bread, spinach, clean water, parks
MACRO OR MICRO ? Macroeconomics: analysis of the economy as a whole Microeconomics: analysis of the behavior of individual decision-making units, such as individual households or businesses.
positive economics: what is or will be normative economics: what ought to be
ceteris paribus: other things constant
apples $0.30 At a particular price of apples, people buy a certain quantity of apples.
apples $0.30 $0.50 Ceteris paribus, when the price of apples increases, people buy fewer apples.
But suppose people’s incomes increase at the same time that the price of fruit goes up. Perhaps, originally we had a little income...
apples $0.30 $0.50 Then people may buy more apples even though the price of apples has gone up. The ceteris paribus assumption (other things constant) has been violated. Income is not constant.
Association is not Causation. Suppose we see both wages and prices rising. Did the increase in wages cause the increase in prices? Did the increase in prices cause the increase in wages? Perhaps neither. Other factors could be causing both wages and prices to rise.
Fallacy of Composition: What is true for the individual may not be true for the entire group.
Example Suppose you suddenly have twice as much income as you did before. Then you could buy twice as much as you could before. Now suppose everyone has twice as much income as before. Could everyone buy twice as much? Probably not. The higher incomes are likely to cause an increase in the price level.
Opportunity Cost: the next best alternative that you had to give up because you chose a particular option. ex: The opportunity cost of going to a basketball game may be the five or ten extra points that you might have earned on an exam by staying home and studying that night.
Production Possibilities Frontier or Production Possibilities Curve (PPF or PPC):a curve that outlines all possible combinations of total output that could be produced assuming • fixed resources • full and efficient use of resources • fixed technology
Example: Suppose you are currently taking just two courses, Economics and History. Suppose also that you have only 10 hours to study each week. If you used all your time for Economics, you might get a 96 average in Economics, but a 48 in History. If you used all your time for History, you might get a 96 average in History, but a 48 in Economics.
If you studied some time for each, you might have a 72 average in each course, or perhaps a 60 in one and a 84 in the other. If you sketch these points on a graph and connect the points, you have the following picture.
History Grade 96 84 72 60 48 60 72 84 96 Economics Grade
Production Possibility Frontier (PPF) History Grade Notice the PPF is negatively sloped, reflecting the tradeoff between your History and Economics grades. You can only do better in one course if you do worse in the other. 96 84 72 60 48 60 72 84 96 Economics Grade
The Production Possibility Frontier shows the best you can do in current circumstances. • You have fixed resources. your brain and your time • You are making full and efficient use of those resources. You are not getting up to get a snack every five minutes. • You have fixed technology. Your knowledge of study techniques is fixed.
Suppose your circumstances change. Perhaps you quit your job, so you now have more time for studying. Before, the only way you could get an A in Economics is if you flunked History. Now with the extra time, you can get an A in Economics and still have enough time to get a D in History.
History Grade Production Possibility Frontier (PPF) 96 84 72 60 48 60 72 84 96 Economics Grade
Your new production possibilities frontier is higher and further to the right than your old PPF.
Suppose now that you are a country producing food and clothing. Your options include the following: option food clothing A 11 4 B 10 5 C 8 6 D 5 7
As you move from one option to another, how much food must you give up to produce another unit of clothing? This amount is the slope of the production possibility frontier. slope = ( DFood / DClothing)
|slope|option Food Clothing | DF/DC | A 11 4 B 10 5 C 8 6 D 5 7 As the amount of clothing increases and the amount of food decreases, the amount of food that you have to give up in order to get another unit of clothing increases. 1 / 1 = 1 2 / 1 = 2 3 / 1 = 3
Why? When you are producing a lot of clothing and not much food, you have only a few resources used to produce food. These are the ones that are much better at making food than at making clothing. If you move those resources from food to clothing production, you will give up a lot of food for only a little clothing.
food Production Possibility Frontier (PPF) 11 10 8 5 clothing 0 4 5 6 7
The concave shape reflects the changing slope we just described. We see this shape when resources are not equally good at producing the different commodities. Since productivity differences seem reasonable, we will usually draw our PPFs with the concave (rather than straight-line) shape.
Production Possibility Frontier (PPF) food Points below the PPF represent unemployment or inefficient use of resources. X clothing
Production Possibility Frontier (PPF) food Points above the PPF represent unattainable combinations. Y clothing
Production Possibility Frontier (PPF) If economic growth occurs, so that it becomes possible to produce more output, the PPF shifts to the right and up. food clothing
Production Possibility Frontier (PPF) food If, for some reason, there is a reduction in resources available for production, the PPF shifts to the left and down. clothing
Comparative Advantage and Gains from Specialization and Trade
Consider two people, Carl and Sam. Both are in the construction business. Suppose that Carl can build 2 brick houses in a month. If he makes frame houses instead, he can build 4 frame houses in that month. Sam can build 1 brick house in a month. If he makes frame houses instead, he can build 1 frame house in that month.
Person A has an absolute advantage over person B in the production of a good if person A can produce the good with fewer resources than person B or equivalently, that person A can produce more of the good than person B with the same resources. In our example, Carl has an absolute advantage over Sam in the construction of both frame and brick houses.
For Carl, the opportunity cost of producing one brick house is two frame houses. For Sam, the opportunity cost of producing one brick house is one frame house. So the opportunity cost of the production of a brick house is lower for Sam than for Carl.
For Carl, the opportunity cost of producing one frame house is 1/2 brick house. For Sam, the opportunity cost of producing one frame house is one brick house. So the opportunity cost of the production of a frame house is lower for Carl than for Sam.
Person A has a comparative advantage over person B in the production of a good if person A has a lower opportunity cost of producing the good.personcomparative advantage Sam brick Carl frame
Law of Comparative Advantage: The total output of a group, an economy, or a group of nations will be greatest when the output of each good is produced by the person (or firm or nation) with the lowest opportunity cost.Let’s see how this law applies to Carl and Sam.
12 Months Production without Specialization frame brick Carl 16 16 Sam 6 6 Total 22 22
11 Months Production with Specialization frame brick Carl 22 11 Sam 0 11 Total 22 22
Recall that the opportunity cost of 1 brick house for Sam is 1 frame house. If Sam can trade some of his brick houses for at least one frame house per brick house, he will be happy. The opportunity cost of 1 brick house for Carl is 2 frame houses. If he can get some brick houses from Sam for less than 2 frame houses per brick house, he will be happy. So the terms of trade will be between 1 and 2 frame houses per brick house.
After construction, Carl and Sam have the following:build Sam brick 11 frame 0 Carl brick 11 frame 22
Suppose that Carl and Sam agree to trade 6 frame houses for 5 brick houses. So we havebuildtrade Sam brick 11 - 5 frame 0 + 6 Carl brick 11 + 5 frame 22 - 6
The result is:buildtraderesultSam brick 11 - 5 6 frame 0 + 6 6Carl brick 11 + 5 16 frame 22 - 6 16
Now Carl and Sam each have the same number of houses as before specialization and trade. However, they are better off now because they get a month of vacation. Alternatively, if they worked a 12-month year, they could produce more houses than before.
Comment:It is comparative advantage, not absolute advantage, that makes gains from trade possible.