Data Analysis Quiz
160 likes | 373 Views
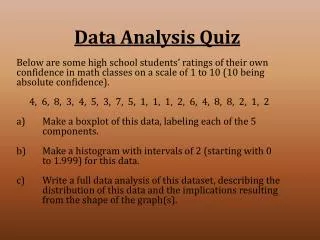
Below are some high school students’ ratings of their own confidence in math classes on a scale of 1 to 10 (10 being absolute confidence). 4, 6, 8, 3, 4, 5, 3, 7, 5, 1, 1, 1, 2, 6, 4, 8, 8, 2, 1, 2 Make a boxplot of this data, labeling each of the 5 components.

Data Analysis Quiz
E N D
Presentation Transcript
Below are some high school students’ ratings of their own confidence in math classes on a scale of 1 to 10 (10 being absolute confidence). 4, 6, 8, 3, 4, 5, 3, 7, 5, 1, 1, 1, 2, 6, 4, 8, 8, 2, 1, 2 Make a boxplot of this data, labeling each of the 5 components. Make a histogram with intervals of 2 (starting with 0 to 1.999) for this data. Write a full data analysis of this dataset, describing the distribution of this data and the implications resulting from the shape of the graph(s). Data Analysis Quiz
Types of Distribution Continuous Uniform Distribution Poisson Distribution
Mean: μ (mew)Standard Deviation: σ (sigma) What is a standard deviation?
Standard Deviation The standard deviation of a dataset is a measure of the variance in the data. - informs us of range in data values Also informative to what percentile a data value fits
Standard Deviation How can you determine how much a dataset varies? Hypothesize. *Check how much each value varies from the mean.
Variance The standard deviation of a dataset is a measure of the variance in the data. Variance = the average of the squared differences from the mean
Standard Deviation The standard deviation of a dataset is a measure of the variance in the data. Standard Deviation = square root of variance
Demo Here are a collection of ten SAT scores: 1432, 1175, 1512, 1757, 1960, 1314, 1258, 2100, 1622, 1304 Assuming normal distribution, find the mean, variance, and standard deviation for the SAT scores.
Standard Deviation Find the mean, variance, and standard deviation for Points For of current NBA teams. (split up the teams for less work) Find the mean, variance, and standard deviation for Points Against of current NBA teams.
Standard Deviation **different types of standard deviationPopulation standard deviation: Standard formula - polling the whole population affected, i.e. all NBA teams, all Sample standard deviation: poll only a portion of the population
Sample Standard Deviation The following is a random sample of ages of people recently diagnosed with type-2 diabetes: 48, 55, 17, 31, 42, 68, 11, 14, 61, 27 Find the mean, variance, and standard deviation for the ages of people diagnosed with type-2 diabetes.
Homework p. 111: 49-58