Download
1 / 1
10 likes | 213 Views
Vertical temperature profiles in the Venus mesophere obtained by two retrieval methods from the VIRTIS observations. P aulina Wolkenberg 1 , Marek Banaszkiewicz 1. 1 Centrum Badań Kosmicznych PAN , ul. Bartycka 18A, 00-716 Warsaw, Poland paulina@cbk.waw.pl. ABSTRACT.

E N D
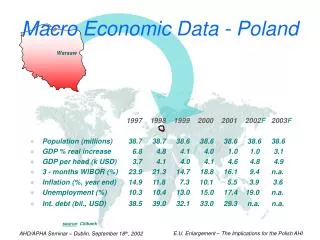
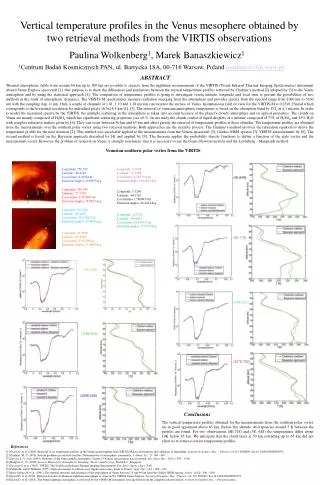
Vertical temperature profiles in the Venus mesophere obtained by two retrieval methods from the VIRTIS observations Paulina Wolkenberg1, Marek Banaszkiewicz1 1Centrum Badań Kosmicznych PAN, ul. Bartycka 18A, 00-716 Warsaw, Poland paulina@cbk.waw.pl ABSTRACT Thermal atmospheric fields from around 60 km up to 100 km are possible to retrieve from the nighttime measurements of the VIRTIS (Visual Infrared Thermal Imaging Spectrometer) instrument aboard Venus Express spacecraft [1]. Our purpose is to show the differences and similarities between the vertical temperature profiles retrieved by Chahine’s method [2] adopted by [3] to the Venus atmosphere and by using the statistical approach [4]. The comparison of temperature profiles is going to investigate versus latitude, longitude and local time to present the possibilities of two methods in the study of atmospheric dynamics. The VIRTIS-M spectrometer measures radiation emerging from the atmosphere and provides spectra from the spectral range from 1000 nm to 5100 nm with the sampling step 11 nm. Only a couple of channels at 1.01, 1.10 and 1.18 micron can monitor the surface of Venus. Instantaneous field of view for the VIRTIS-M is 0.25x0.25mrad which corresponds to the horizontal resolution for individual pixels 16.5x16.5 km [1], [5]. The retrieval of venusian atmospheric temperature is based on the absorption band by CO2 at 4.3 micron. In order to model the measured spectra by the VIRTIS, the multiple scattering in the atmosphere is taken into account because of the planet’s cloudy atmosphere and its optical properties. The clouds on Venus are mainly composed of H2SO4 which has significant scattering properties (ssa >0.5). In our study the clouds consist of liquid droplets of a mixture composed of 75% of H2SO4 and 25% H2O with complex refractive indices given by [6]. They can occur between 50 km and 65 km and affect greatly the retrieval of temperature profiles at these altitudes. The temperature profiles are obtained from the measurements over the southern polar vortex using two retrieval methods. Both approaches are the iterative process. The Chahine’s method involves the relaxation equation to derive the temperature profile for the next iteration [2]. This method was successful applied to the measurements from the Venera spacecraft [3], Galileo-NIMS spectra [7], VIRTIS measurements by [8]. The second method is based on the Bayesian approach described by [4] and applied by [9]. The theorem applies the probability density functions to define a function of the state vector and the measurement vector. However, the problem of retrieval on Venus is strongly non-linear, thus it is necessary to use the Gauss-Newton iteration and the Levenberg – Marquardt method. Venusian southern polar vortex from the VIRTIS Longitude: 358.545 Latitude: -80.4210 Local time= 2.22562 hr Emission Angle= 30.8903 deg Longitude: 8.1874 Latitude: -71.2769 Local time= 1.5827733 hr Emission Angle= 40.4835 deg (5E,64S) Longitude: 356.649 Latitude: -75.7559 Local time= 2.3519867 hr Emission Angle= 35.9851 deg Longitude: 5.1286 Latitude: -64.1510 Local time= 1.7866933 hr Emission Angle= 48.2421 deg Longitude: 104.246 Latitude: -80.4467 Local time= 19.178853 hr Emission Angle= 19.0698 deg Longitude: 115.552 Latitude: -80.6811 Local time= 18.425113 hr Emission Angle= 17.0213 deg Longitude: 33.0396 Latitude: -83.8356 Local time= 23.92596 hr Emission Angle= 25.9404 deg (8E,71S) (33E,84S) (104E,80S) (116E,81S) (357E,76S) (359E,80S) Conclusions The vertical temperature profiles obtained for the measurements from the southern polar vortex are in good agreement above 65 km. Below this altitude, discrepancies around 5 K between the profiles are found. For two observations (8E,71S) and (5E, 64S) the temperatures differ about 10K below 65 km. We anticipate that the cloud layer at 50 km extending up to 65 km did not allow us to retrieve correct temperature profiles. References [1] Grassi D. et al. (2008), Retrieval of air temperature profiles in the Venusian mesosphere from VIRTIS-M data: Description and validation of algorithms, Journal of Geophys. Res. – Planets, vol.113, E00B09, doi:10.1029/2008JE003075. [2] Chahine, M. T. (1970), Inverse problems in radiative transfer: Determination of atmospheric parameters, J. Atmos. Sci., 27, 960 - 967 [3] Zasova, L. V. et al. (1999), Structure of the Venus middle atmosphere: Venera 15 Fourier spectrometry data revistited, Adv. Space Res., 23(9), 1559 – 1568. [4] Rodgers, C., D. (2000), Inverse Methods for Atmospheric Sounding: Theory and Practice, World Sci., Singapore. [5] Piccioni G. et al. (2007), VIRTIS: The Visible and Infrared Thermal Imaging Spectrometer, Eur. Space Agency Spec. Publ. [6] Palmer K. and D.Williams (1975), Optical constants of sulfuric acid: Application to the clouds of Venus?, Appl. Opt., 14(1), 208 – 219. [7] Roos-Serote M. et al. (1995), The thermal structure and dynamics of the atmosphere of Venus between 70 and 90 km from the Galileo-NIMS spectra, Icarus, 114(2), 300 – 309. [8] Grassi D. et al (2010), Thermal structure of Venusian nighttime mesosphere as observed by VIRTIS-Venus Express, Journal of Geophys. Res. - Planets, vol. 115, E09007, doi:10.1029/2009JE003553. [9] Grassi D. et al. (2014), The Venus nighttime atmosphere as observed by the VIRTIS-M instrument. Average fields from the complete infrared dataset.Journal of Geophys. Res. – Planets,in press.