Download

1 / 28
280 likes | 421 Views
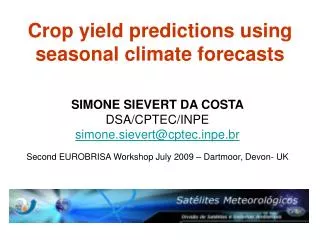
Linking Seasonal Forecast To A Crop Yield Model. SIMONE SIEVERT DA COSTA DSA/CPTEC/INPE – CNPq simone@cptec.inpe.br HOMERO BERGAMASCHI UFRGS First EUROBRISA Workshop 17-19 March 2008 –Paraty, RJ - Brazil. Talk Outline. Aim Study region Motivation

E N D
Linking Seasonal Forecast To A Crop Yield Model SIMONE SIEVERT DA COSTA DSA/CPTEC/INPE – CNPq simone@cptec.inpe.br HOMERO BERGAMASCHI UFRGS First EUROBRISA Workshop 17-19 March 2008 –Paraty, RJ - Brazil
Talk Outline • Aim • Study region • Motivation • Crop model calibrated for South America • Methods (Bias Correction) • Results • Future Direction
Aim Produce maize crop yield prediction based on climate information (seasonal forecasts). Crop yield model Climate Forecast National Statistics Maize Grain Yield Source: IBGE
The Area of Study 27.2°- 29.8°S/51.2°- 56.0°W Rio Grande Do Sul State (RS) “Long River of South”
About Maize in RS… After USA and China, Brazil is the main maize producer in the entire world, and RS is the second greatest producer nationally (IBGE, 2006). Sowing Date: Sep/Oct Harvest: Feb Crop cycle ~130 days
Motivation: Crop and Climate Relationship Correlation btw obs.maize yield and rainfall Santa Rosa Passo Fundo Main producer region (all shaded area in the map) Data Source: crop yield (IBGE) rainfall (INMET, FEPAGRO) Bergamaschi et al. 2008
http://w3.ufsm.br/solos/boletim3.php Standardised rainfall and yield anom. • Rainfall in all cycle (~130-140 days) 0.56 • Rainfall in 0-30 days after tasselling 0.72 Bergamaschi et al. 2008
Can crop model to reproduce the interannual variability of maize yield? Source: IBGE
Crop model: General Large Area ModelChallinor et al., 2003 Yield is a time varying fraction of Biomass GLAM is a processed based crop model, which simulates soil water budget, crop plant phenology, canopy growth, root growth, aerial dry mass and grain yield YIELD BIOMASS Transpiration Efficiency ROOT SYSTEM TRANSPIRATION Development Stage LEAF CANOPY SOIL WATER Yield Gap Parameter Water Stress Outputs Schematic diagram of GLAM (adapted from crop and climate group webpage-Reading)
Crop model: GLAM adapted to RS • GLAM were initially tested for groundnut yield across India (Challinor et al., 2003) , and it was adapted to simulate maize yield for RS (Bergamaschi et.al., 2008 in preparation.).
Muller et al., 2005 Calibration GLAM were based on observational data (soil and crop phenology). UFRGS, Eldorado do Sul Site, Brazil.
Input data to GLAM: Daily data required: Yield is a time varying fraction of Biomass YIELD BIOMASS Solar Radiation Min. Temperature Max. Temperature Rainfall Transpiration Efficiency ROOT SYSTEM TRANSPIRATION Development Stage LEAF CANOPY SOIL WATER Yield Gap Parameter Water Stress Outputs Schematic diagram of GLAM (adapted from crop and climate group webpage-Reading)
Maize Grain yield Estimative using GLAM and observed weather data Observed weather data from meteorological site (P, T, Rad.) FEPAGRO, INMET GLAM GLAM OBS (IBGE)
Can GLAM be used to do crop prediction with daily seasonal forecast data?
Seasonal weather data:11 ensemble member ECMWF (single grid point)
Seasonal weather data into crop model: • Daily Precipitation (a grid point) • - 11 ensemble member from ECMWF model • first month of each forecasts initialized in Sep, Oct, Nov, Dec, Jan, Feb. (RS crop cycle) Rad. & Temp. Observation Daily mean climatology for wet and dry days (1998 – 2005) Forecast issued Sep. 1997
ECMWF Daily Climatology (1998-2005) for crop cycle Mean Rainfall (mm/day) sep oct nov dec jan fev month obs Ensemble mean Indiv. Member
Rainfall decomposition: • Monthly Mean Rainfall R : R(mm d-1) = I(mm wd-1) x f(wd d-1) intensity frequency d=day wd=wet day (Ines and Hansen, 2006)
Intensity (mm/wd) sep oct nov dec jan fev month Frequency (wd/d) Obs. Indiv. Member Emsemble Mean sep oct nov dec jan fev month
Methods - Bias Correction of daily GCM: -Frequency (wd day-1) – wd = wet day observation F(pobs=0) a) F(pgcm=0) c) Cumulative distribution function P0 – used to truncate the GCM distribution=mean frequency of rainfall abv p0 matches the obsv. Rainfall. GCM b) Ines and Hansen (2006) Dailyrainfall (mm)
Methods - Bias Correction of daily GCM: -intensity (mm wd-1) F(pi) observation GCM b) pgcm p’gcm Ines and Hansen (2006)
Methods - Bias Correction of daily GCM: -Multiplicative Shift
Bias correction Mean Rainfall (mm/day) uncorrected sep oct nov dec jan fev month mult. shift sep oct nov dec jan fev month Obs. Indiv. Member Ensemble Mean sep oct nov dec jan fev month
Bias correction Intensity (mm/wd) uncorrected sep oct nov dec jan fev month mult. shift sep oct nov dec jan fev month Obs. Indiv. Member Ensemble Mean sep oct nov dec jan fev month
Bias correction frequency (wd/d) uncorrected sep oct nov dec jan fev month mult. shift sep oct nov dec jan fev month Obs. 11 GCM Mem. Mean GCM sep oct nov dec jan fev month
Hindcast of Yield– Main producer region DATA INPUT FORECAST: OBS = observed weather data UNC = uncorrected seasonal forecast MS = seasonal forecast corrected using multiplicative shift IF = seasonal forecast, intensity & frequency correction method
Future Direction • Statistical downscaling – to take advantage of regional of seasonal forecast skill (spatial calibration). • Use of weather generator – to reproduce daily data (temporal disaggregation). • Use of space-temporal downscaled daily prediction into crop model. • Compared skill of different crop yield forecast approach (grid point and spatial downscaled data).
Thanks: • Andrew Challinor (The University of Leeds-UK) • Caio Coelho (CPTEC- Brazil) • Homero Bergamaschi (UFRGS, Brazil) • Tim Wheeler (The University of Reading-UK) • Jim Hansen (IRI – USA) • Walter Baethgen (IRI – USA)