Download
1 / 25
250 likes | 473 Views
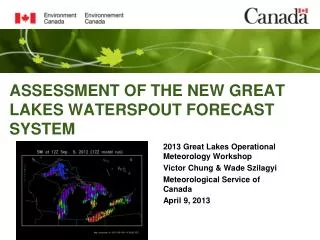
ASSESSMENT OF THE NEW GREAT LAKES WATERSPOUT FORECAST SYSTEM. 2013 Great Lakes Operational Meteorology Workshop Victor Chung & Wade Szilagyi Meteorological Service of Canada April 9, 2013. Introduction – The Great Lakes Waterspout Forecast System (GLWFS).

E N D
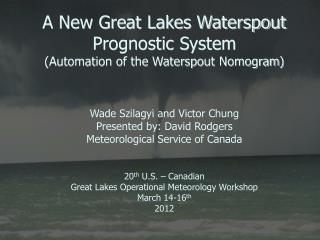
ASSESSMENT OF THE NEW GREAT LAKES WATERSPOUT FORECAST SYSTEM 2013 Great Lakes Operational Meteorology Workshop Victor Chung & Wade Szilagyi Meteorological Service of Canada April 9, 2013
Introduction – The Great Lakes Waterspout Forecast System (GLWFS) • Experimental tool → potential for waterspouts over the Great Lakes • Output → Szilagyi Waterspout Index (SWI), 0-48 hrs • Automation of the Waterspout Nomogram • Used for the first time in 2012 at the OSPC
Verification Considerations -Seasonal Period • Peak of waterspout season (August - September) chosen
Verification Considerations - Diurnal Time Period • Daytime only (12-18Z, 18-24Z)
Verification Considerations – Areal Coverage • Half lake resolution (marine forecast sub-zones)
Verification - Database • 13,180 entries
Verification - Database • Date (Aug. – Sept.) • Time (12-18Z, 18-24Z) • Location (i.e. western Lake Erie) • Forecast/Observed/Possible Waterspouts (Yes/No) • Forecast SWI (<0, 0, 1,…,10) • SWI Percent Coverage (0, 25, 50, 75,100%) • Forecast/Observation Location Correlation (Yes/No) • Lead Time (0-48 hrs)
Verification - Results • N = 1,318
Verification - Results • Average Lead Time = 36 hrs! • Forecast/Observation Location Correlation = 92% • Forecast SWI value -waterspout events most frequently associated with forecast SWI ≥ 7 • SWI Percent Coverage -over half of the events occurred when coverage was ≥ 75% → SWI areal coverage is a factor to consider when forecasting waterspouts
1500Z, Aug 09, 2012 1604z 1542z A few waterspouts 1601z
1800Z, Aug 09, 2012 1700z 1710z Funnels and 2 waterspouts 1700z A few waterspouts 1710-1735z Multiple waterspouts 1926z
2100Z, Aug 09, 2012 2137z Multiple waterspouts 2145z
0600Z, Aug 10, 2012 0524z
1200Z, Aug 10, 2012 1242-1248z 2 waterspouts
0000Z, Aug 11, 2012 Early evening 2 funnels
1200Z, Aug 11, 2012 1330z
1500Z, Aug 11, 2012 1630z
2100Z, Aug 11, 2012 2000z
0000Z, Aug 12, 2012 2325z
1200Z, Aug 12, 2012 1506z 1510-1525z 2+ waterspouts
Conclusion The Waterspout Forecast System: • Has a very good lead time • Has excellent rare event skill score • Has good non-rare event skill scores
Future Work • Include surface convergence (SWI → ESWI) • Higher resolution model output (horizontal and vertical) • Distinguish between “Severe Wx” vs “Fair Wx” waterspouts • Expand to other marine areas: Atlantic/Pacific coasts, globally • Experimental → Operational • Investigate use as a landspout forecast tool