Download
1 / 27
270 likes | 342 Views
Analyzing climate change impacts on water and salmon, discussing management adaptations. Study on Butte Creek, California. Models used for predictions and management strategies.

E N D
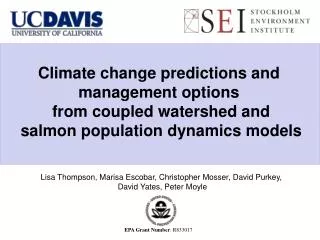
Climate change predictions and management options from coupled watershed and salmon population dynamics models Lisa Thompson, Marisa Escobar, Christopher Mosser, David Purkey, David Yates, Peter Moyle EPA Grant Number: R833017
Big picture points • Long-term survival of salmon in our study area is questionable • Water management adaptations may extend survival • Analytical framework we developed here may be useful elsewhere
How might climate change impact water temperature and flow? How might these changes impact spring-run Chinook salmon? Can we counter-act climate impacts through water management? Thompson, L.C., Escobar, M.I., Mosser, C.M., Purkey, D.R., Yates, D., Moyle, P.B. 2011. Water management adaptations to prevent loss of spring-run Chinook salmon in California under climate change. J. Water Resour. Plann. Manage., 10.1061/(ASCE)WR.1943-5452.0000194 (Aug. 31, 2011). Project Goals
Outline • Butte Creek watershed • Modeling approach • WEAP model • Hydrology • Water temperature • SALMOD model • Population dynamics • Climate scenarios • Management options
Butte Creek Watershed Reaches and Subreaches for Temperature Module Subwatersheds for Rainfall Runoff Module Location of Butte Creek and Feather River Watersheds in California Butte Creek Feather River
Analytical Framework Calibration Climate Interpolated Observations 1986-2005 Daily: P, Tair, RH, Wind Stream Observations 2001-2008 Weekly mean: Qobs, Twaterobs Definitions: P = precipitation Tair = air temperature RH = relative humidity Rnet = net radiation Qobs = observed flow Twaterobs = observed water temperature Qmod = modeled flow Twatermod = modeled water flow Reservoir Temperature Stratification WEAP-1D Watershed Hydrology, Hydropower and Management WEAP Weekly: Rnet, P, Tair, Wind Calibrated to Qobsand Twaterobs Qmod , Twatermod Population Dynamics SALMOD mesohabitat unit, fish distribution, weekly fish mortality Final calibration to Qobs, Twaterobs Fish abundance
Analytical Framework Projections Calibration Climate Downscaled Projections 2009-2099 Daily: P, Tair, RH, Wind Climate Interpolated Observations 1986-2005 Daily: P, Tair, RH, Wind Stream Observations 2001-2008 Weekly mean: Qobs, Twaterobs Reservoir Temperature Stratification WEAP-1D Reservoir Temperature Stratification WEAP-1D Watershed Hydrology, Hydropower and Management WEAP Weekly: Rnet, P, Tair, Wind Calibrated to Qobsand Twaterobs Watershed Hydrology, Hydropower and Management WEAP Weekly: Rnet, P, Tair, Wind Qmod , Twatermod Qmod , Twatermod Population Dynamics SALMOD mesohabitat unit, fish distribution Population Dynamics SALMOD mesohabitat unit, fish distribution, weekly fish mortality Final calibration to Qobs, Twaterobs Fish abundance Fish abundance
WEAP: Hydrologic and water management model • Developed by Stockholm Environment Institute • Integrates watershed hydrologic processes with the water resources management system • Climatic information direct input • Based on a holistic vision of integrated water resources management – supply and demand
WEAP modeling period: 1986-2005 • Input Climate data – CCRC • (http://meteora.ucsd.edu/cap/scen08_data.html)
Operations • Infrastructure • Diversions • Reservoirs • Powerhouses • Operations • Flow Requirements • Operation Rules • Priorities
Pool Riffle Run TemperatureModelDomain
SALMOD Holding / Spawning Adults Returning Adults • Population dynamics model structure (simplified) • Deterministic, weekly time step, spatially explicit • Developed / modified by USGS Temperature Flow Habitat Eggs and Alevin Ocean Fry Fecundity (eggs/female) Growth Mortality Movement Outmigrating Juveniles 0+ Parr 1+ Parr
SALMOD Calibration Observed Predicted R2 = 0.93
Climate Predictions • California Climate Change Center • Bias corrected • Spatially downscaled • Maurer and Hidalgo, 2008 • 2 Emission Scenarios • SresA2 = business as usual • SresB1 = low emission • 6 General Circulation Models (GCMs) • cnrmcm3 (CNRM CM3) • gfdlcm21 (GFDL CM2.1) • miroc32med (CCSR MIROC 3.2 med. Res.) • mpiecham5 (MPI-OM ECHAM5) • ncarccsm3 (NCAR CCSM3.0) • ncarpcm1 (NCAR PCM1) • Ensemble of models and scenarios • Envelope of climate predictions
Summer Survival of Adult Salmon Year Added 15,000 adults each spring Calculated proportion that survived to spawn Extinction criterion = 4 years with no survival
Management Adaptations • No diversion • Cold water savings • Combination of both
Management Adaptations and Temperature Leave water in upper half of salmon habitat 2oC
Management Adaptations and Survival Time Climate change No diversion Cold water savings Combination of both Years Until Extinction Threshold Met Climate Scenario
Outcomes • Climate Scenarios • A2 - Salmon gone for all models • B1 - Salmon may last to end of century • Management Adaptations • No diversion • Salmon survival time extended 0 – 17 years • Loss of hydropower production • Cold water savings • No improvement or worse • No diversion + cold water savings • Any benefits due to “no diversion”
More water management adaptations Additional reservoir operations Improve reservoir management – use short-term weather predictions to improve timing of water transfer Hydropower impacts due to water management changes Economic implications of water management for agricultural production Climate change impacts on fish in other watersheds Implications
Big picture points • Long-term survival of spring-run Chinook salmon in Butte Creek is questionable • Water management adaptations may extend survival • Analytical framework (linked models) we developed here may be a useful tool elsewhere
Acknowledgements • US Environmental Protection Agency • US Geological Survey • California Department of Fish and Game • Pacific Gas and Electric • US Fish and Wildlife Service • Friends of Butte Creek • California Sportfishing Protection Alliance • Journal of Water Resources Planning & Management • Editors and reviewers
Summary Photo by Lisa Thompson