Download
1 / 14
140 likes | 345 Views
Bio277 Lab 2: Clustering and Classification of Microarray Data. Jess Mar Department of Biostatistics Quackenbush Lab DFCI jmar@hsph.harvard.edu. Machine Learning. Machine learning algorithms predict new classes based on patterns discerned from existing data.

E N D
Bio277 Lab 2: Clustering and Classification of Microarray Data Jess Mar Department of Biostatistics Quackenbush Lab DFCI jmar@hsph.harvard.edu
Machine Learning Machine learning algorithms predict new classes based on patterns discerned from existing data. Goal: derive a rule (classifier) that assigns a new object (e.g. patient microarray profile) to a pre-specified group (e.g. aggressive vs non-aggressive prostate cancer). Classification algorithms are a form of supervised learning. Clustering algorithms are a form of unsupervised learning.
The Golub Data Golub et al. published gene expression microarray data in a 1999 Science paper entitled: Molecular Classification of Cancer – Class Discovery and Class Prediction by Gene Expression Monitoring. The primary focus of their paper was to demonstrate the use of a class discovery procedure which could assign tumors to either acute myeloid leukemia (ALL) versus acute lymphoblastic leukemia (AML). Bioconductor has this (pre-processed) data packaged up in golubEsets. > library(golubEsets) > library(help=golubEsets)
1 2 3 4 1 2 3 4 Some Clustering Algorithms for Array Data Hierarchical Methods: Single, Average, Complete Linkage plus other variations. Partitioning Methods: Self-Organising Maps (Köhonen) K-Means Clustering Gene shaving (Hastie, Tibshirani et al.) Model based clustering … Plaid models (Lazzeroni & Owen)
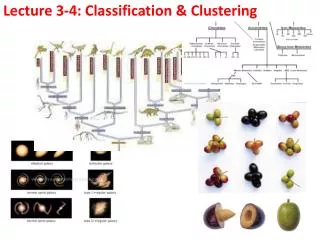
Cluster Analysis • Clustering genes on the basis of experiments or across a time series. • Elucidate unknown gene function. • Clustering slides on the basis of genes. • Discover subclasses in tissue samples. A clustering problem is generally much harder than a classification problem because we don’t know the number of classes. Hierarchical Methods: (Agglomerative, Divisive) + (Single, Average, Complete) Linkage… Model-based Methods: Mixed models. Plaid models. Mixture models…
n genes in 1 cluster divisive agglomerative n genes in n clusters Hierarchical Clustering Source: J-Express Manual We join (or break) nodes based on the notion of maximum (or minimum) ‘similarity’. Euclidean distance (Pearson) correlation
Different Ways to Determine Distances Between Clusters Single linkage Complete linkage Average linkage
Implementing Hierarchical Clustering Agglomerative hierarchical clustering with the function agnes: > colnames(eset.filt) <- classLabels > plot(agnes(dist(t(eset.filt) , method="euclidean")))
Principal Component Analysis Multi-dimensional scaling tool. See GC's lectures for a more in depth treatment. In our Golub data set, PCA will take the data (~500 genes x 72 samples) and map each sample vector (ALL or AML) from 558 dimensions to 2 dimensions. > pca.samples <- princomp(eset.filt) > plot(pca.samples)
Classification Example: Support Vector Machine • For this example we will use data from Golub et al. • 47 patients with ALL, 25 patients with AML • 7129 genes from an Affymettrix HGU6800 but we'll take a subset for this example. • > library(MLInterfaces) ; library(golubEsets) • > library(e1071) • > data(golubMerge) • To fit the support vector machine: • > model <- svm(classLabels[1:40]~., data=t(eset.train))
Visualizing the SVM What predictions were made for the test set? predLabels <- predict(model, t(eset.test)) > predLabels ALL ALL ALL ALL ALL ALL ALL ALL ALL ALL ALL ALL ALL ALL ALL ALL ALL ALL ALL ALL ALL AML AML AML AML AML AML AML AML AML ALL ALL ALL ALL ALL ALL ALL ALL ALL ALL ALL ALL ALL ALL ALL ALL ALL ALL ALL ALL ALL AML AML AML AML AML AML AML AML AML AML AML AML AML Levels: ALL AML How do these stack up to the true classification? > trueLabels <- classLabels[41:72] > table(predLabels, trueLabels) trueLabels predLabels ALL AML ALL 21 0 AML 0 11
More Materials, More Labs? Hypothesis Testing of Differentially Expressed Genes Gene Set Enrichment Clustering Classification Support Vector Machines Lecture Topics Covered Since Last Lab Tutorial: BioConductor Tour