Download
1 / 13
130 likes | 147 Views
This study explores the potential benefits of assimilating simulated Doppler radar data into quantitative precipitation forecasting using the WRF-3DVAR system. The evaluation is done through Observing System Simulation Experiments (OSSEs) and focuses on a dryline case in the central U.S. The results show improved wind retrieval, temperature and microphysical variable retrieval, and precipitation forecasting compared to no assimilation. The use of cycling mode in 3DVAR prevents rapid error increase during convective development.

E N D
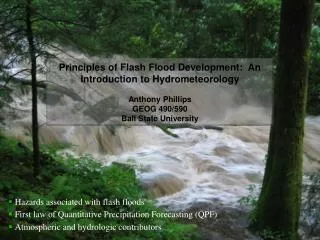
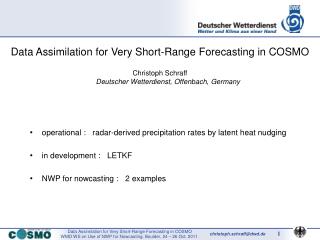
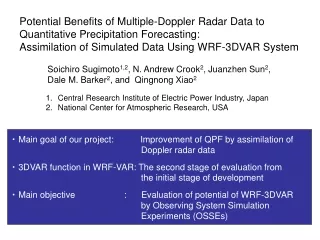
Potential Benefits of Multiple-Doppler Radar Data to Quantitative Precipitation Forecasting: Assimilation of Simulated Data Using WRF-3DVAR System Soichiro Sugimoto1,2, N. Andrew Crook2, Juanzhen Sun2, Dale M. Barker2, and Qingnong Xiao2 • Central Research Institute of Electric Power Industry, Japan • National Center for Atmospheric Research, USA ・ Main goal of our project: Improvement of QPF by assimilation of Doppler radar data ・ 3DVAR function in WRF-VAR: The second stage of evaluation from the initial stage of development ・ Main objective : Evaluation of potential of WRF-3DVAR by Observing System Simulation Experiments (OSSEs)
The use of a NWP model for • QPF of convective weather • is plagued by … 2100Z, June 12, 2002 6-hrs forecasts 2100Z, June 12, 2002 9-hrs forecasts • Poor specification of the • initial and boundary • conditions • The improper evolution of • convection 0000Z, June 13, 2002 9-hrs forecasts 0000Z, June 13, 2002 12-hrs forecasts • Better initial and boundary • conditions are required. Difference between forecasts motivates to assimilate radar data . WRF simulations for a dryline case (1-h accumulated precipitation) Introduction and Motivation • Evaluation of the maximum • potential of the methodology • with simulated data Initial: 1500Z, June 12 Initial: 1200Z, June 12
Setup of OSSE An example of time schedule June 13, 2002 0000Z 1200Z 1500Z 2100Z 0300Z For making the truth and observations radar data Assim. and Fcst. background For making the background (no-assimilation) # Two WRF simulations use the same model configuration. Tips - WRF model: Version 2.0.3.1 - Horizontal grid spacing: 4 km (300x300) (right panel) - Unbiased normal distribution (observation error) • Background error estimated by the NMC method • (tuning horizontal lengthscale and • eigenvectors/eigenvalues of the vertical component) 25 NEXRAD sites in our domain
Radar Data Assimilation using 3DVAR Cost function x: a vector of analysis Xb: a vector of background (first-guess) y: a vector of model-derived observation (y=H(x); observation operator) yo: a vector of observation B: the background error covariance matrix R: the observation and representative error covariance matrix Importance to note Vertical fallspeed of hydrometeor Reflectivity factor #1 Water substance: Only rainwater #2 Control variable of moisture: Total water mixing ratio “qt” (water vapor, rainwater, cloud water) A warm rain regime is considered for partitioning of qt increment to increments of model variables in control variable transformation. Modification of the background by a cloud analysis based on water budget analysis. #3 Background close to the correct state is important.
Application to a dryline case occurred in the central U.S. Result 1: Wind retrieval using radial velocity data with the cold-start mode. An idealized situation that observations are available on all grid points. Result 2: Wind retrieval using radial velocity data with the cycling mode. Data within a storm is used. 15-min interval of cycling. Result 3: Retrieval of temperature and microphysical variables by additional use of reflectivity factor data. Data within a storm is used. Result 4: Precipitation forecasting Comparisons among cases of “no-assimilation”, “radial velocity assimilation”, and “assimilation of both of radial velocity and reflectivity factor”
Wind Retrieval Using Idealized Data of Radial Velocity with Cold-Start Mode U-wind component W-wind component Observation (O) Minus Background (B) (innovation) The retrieval is successful at a scale relatively larger than the convective scale. Analysis (A) Minus Background (B) (Increment)
Wind Retrieval Using Idealized Data of Radial Velocity (Cont’d) RMS error for each level U-wind component W-wind component RMS error in the wind field is reduced by 3DVAR analysis. Benefit is likely smaller for the vertical wind than the one for horizontal winds.
This is due to degraded accuracy of W-component. Benefit of the Use of Cycling Mode (Storm Data) RMS error in V-component 2100Z – 0000Z (15 min. interval) Developing to Mature Initiation Each of 3DVAR analysis reduces error. The use of cycling 3DVAR prevents from rapid increase of error. Retrieval of vertical wind component is challenging especially when the convection is in the developing stage.
Retrieval of Temperature and Microphysical Variables with Reflectivity Data Temperature Water vapor O-B Innovation A-B Increment A-B Increment O-B Innovation Water vapor retrieval is difficult In lower levels. Overall reasonable result Low-level O-B Innovation A-B Increment A-B Increment O-B Innovation Middle-level
Retrieval of Temperature and Microphysical Variables with Reflectivity Data Rainwater O-B Innovation A-B Increment RMS error in each variable is reduced by 3DVAR & cloud analysis. Cloud Water O-B Innovation A-B Increment
Thread score for 3-hrs forecast A little better Better (lasting over 3 hrs ahead) Impact on Precipitation Forecasting 1-h accumulated precipitation June 13, 2002 0000Z Assimilation at the mature stage of convection June 13, 2002 0100Z 1-hr ahead 1-hr ahead 1-hr ahead No-Assimilation Radial velocity Both Truth
Thread score for 3-hrs forecast Better than only radial velocity assimilation. Better (larger impact than the previous case) Impact on Precipitation Forecasting 1-h accumulated precipitation June12, 2002 2100Z Assimilation at the initiation stage of convection June13, 2002 0000Z 3-hrs ahead 3-hrs ahead 3-hrs ahead No-Assimilation Radial velocity Both Truth
Summary • Radial velocity assimilation works reasonably well in recovering key features • of the wind field at scales relatively larger than the convective scale. 2. A more sophisticated dynamic framework with a flow-dependent background error statistics will be need for the retrieval at the convective scale. 3. The use of cycling mode 3DVAR serves to prevent the rapid increase of model error with time. 4. Positive impact on precipitation forecasting is found only with radial velocity assimilation, especially when the convection is in the initiation stage. 5. Additional use of reflectivity factor is encouraging for improving QPF if the convection is in the developing or mature stage. 6. The combined use of 3DVAR and a cloud analysis works to some extent for the retrieval of unobserved variables even when the background has no convection whereas the observation indicates the existence of convection.


![L 23 – Vibrations and Waves [3]](https://cdn1.slideserve.com/1713456/l-23-vibrations-and-waves-3-dt.jpg)