Funnel Plots of Mantel-Haenszel Log Risk Ratios for Asymptomatic and Symptomatic Series
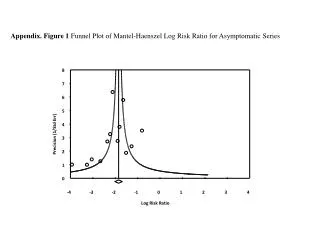
This appendix illustrates the funnel plots of Mantel-Haenszel log risk ratios for both asymptomatic and symptomatic series. Figure 1 depicts the asymptomatic series, showing precision on the y-axis against log risk ratios on the x-axis. Figure 2 focuses on the symptomatic series, detailing the same metrics. These plots are essential for visualizing potential publication bias in epidemiological studies, providing insights into the distribution of effect sizes and the reliability of the estimates.

Funnel Plots of Mantel-Haenszel Log Risk Ratios for Asymptomatic and Symptomatic Series
E N D
Presentation Transcript
Appendix. Figure 1 Funnel Plot of Mantel-Haenszel Log Risk Ratio for Asymptomatic Series 8 7 6 5 4 Precision (1/Std Err) 3 2 1 0 -4 -3 -2 -1 0 1 2 3 4 Log Risk Ratio
Appendix.Figure 2 Funnel Plot of Mantel-Haenszel Log Risk Ratio for Symptomatic Series 2.0 1.5 1.0 Precision (1/Std Err) 0.5 0.0 -4 -3 -2 -1 0 1 2 3 4 Log Risk Ratio