Download
1 / 36
360 likes | 382 Views
This study utilizes Argo float data to analyze the distribution and temporal changes of the mixed layer depth in the North Pacific. The findings reveal differences between Argo and climatological data, indicating the importance of high-resolution observations.

E N D
Distribution and variation of the mixed layerin the North Pacific observed by using Argo floats Yuko Ohno1, Taiyo Kobayashi2, Naoto Iwasaka1,2, Toshio Suga21 Tokyo University of Marine Science and Technology2 Frontier Observational Research System for Global Change
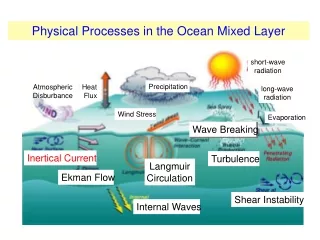
Introduction Air-sea heat exchange Mixed layer is important for the large scale ocean-atmosphere system Mixed layer Water mass formation
Lack of the spatially and temporally dense data Most of studies performed on theclimatologicaldata. e.g. Levitus, 1982 ; Suga and Hanawa 1990 We describe the distributions and time change of mixed layer with Argo floats data in the North Pacific.
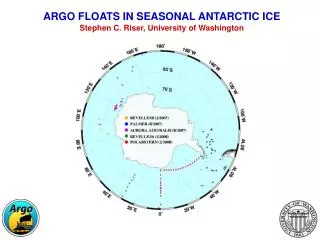
*Argo floats data(number of profiles:13025) (April 2000 ~ August 2003) *CTD data(number of profiles:2440) (January 2000 ~ December 2001) *World Ocean Atlas 1998(WOA98) as climatology Data
observed points Blue : Argo floats data Pink : CTD data
The definition of the Mixed layer depth Mixed layer depth (MLD) σθ( 10m) + Δσθ Δσθ=0.125kg/m3 (e.g. Levitus, 1982 ; Uehara et al.,2003) *The number of data of MLD 13420 Mixed layer depth
MLDs from Argo floats data in March( Contour line indicated MLDs from WOA98 (interval is 20m) ) Up to 438m Up to 130m deep shallow
MLDs from Argo floats data in March( Contour line indicated MLDs from WOA98 (interval is 20m) ) Up to 364m Up to 438m deep shallow
Differences of MLDs (Argo-WOA98)(Contour lines are MLDs inferred from WOA98 (Interval is 20m)) Argo < WOA98 Argo > WOA98
Many Argo obs. were more than 50m shallower than WOA98 . Differences of MLDs (Argo-WOA98)(Contour lines are MLDs inferred from WOA98 (Interval is 20m)) The nonlinear nature of the equation of state of sea water The averaging procedure used to compute the WOA98 would result in artificially dense water in such a frontal zone. Suga et al.,(2003) Argo < WOA98 Argo > WOA98
Differences of MLDs (Argo-WOA98)(Contour lines are MLDs inferred from WOA98 (Interval is 20m)) Spatial scale of the smoothing filter used in the WOA98 seem to be too large. Suga et al.,(2003) Many Argo obs. were more than 100m deeper than WOA98. Argo < WOA98 Argo > WOA98
Area-1 34.0N 147.0E Area-2 44.5N 170.0E Area-2 North of the Kuroshio Extension Area-1 South of the Kuroshio Extension
Area-1 (34.0N 147.0E) 2000 2001 2003
Area-1 (34.0N 147.0E) 2000 2001 2003
MLD in Area-1 Obs.MLD WOA98 MLD 362 93 455
MLD in Area-1 Obs.MLD WOA98 MLD 164 164 195 288 362 455
MLD in Area-1 Obs.MLD WOA98 MLD 2 months
Area-2 (44.5N 170.0E) 2000 2001 2003
Area-2 (44.5N 170.0E) 2000 2001 2003
MLD in Area-2 Obs.MLD WOA98 MLD 1 month
Summary • Deep mixed layers over 250m concentrated in the north • and south of the Kuroshio Extension. 2 Comparing the observed MLDs with climatology・・・ Argo < Climatology Kuroshio Extension Argo > Climatology
Summary (continued) • There were several regions which show the seasonal • change differ from climatology. • ・The observed amplitude was twice more than that of • climatology in maximum. • ・There were differences of phase of MLD • up to 2 months in winter.
The calculation of the Mixed layer depth Calculate the potential density (with Hydro Base) Interpolate the potential density to 500m by 1m(Akima,1970) If the profile contained data from 10m to 500m completely Mixed layer Depth (MLD)
Differences of MLDs (Argo-WOA98)(Contour lines are MLDs inferred from WOA98 (Interval is 20m))
The way to select small areas 10 days = 1 term • We counted the number of the term which contained a profile or more in a circle. • We finally chose 2 small circles in which the float observation covered winters. • We chose the circles which had 36 terms or more. 0.5 • For the selected circles we checked the continuity of the periods.
MLD in Area-1 Obs.MLD WOA98 MLD 16 164 7 2
MLD in Area-1 Obs.MLD WOA98 MLD 12 362 93 4 455 2 7
MLD in Area-2 Obs.MLD WOA98 MLD 14 148 8 3
MLD in Area-2 Obs.MLD WOA98 MLD 145 151 3 2
Area-2 (44.5N 170.0E) 2000 2001 2003
Area-2 (44.5N 170.0E) 2000 2001 2003