Building Timelines
250 likes | 266 Views
Learn how to create engaging timelines that tell a story effectively. This guide provides tips on organizing events, using color themes, and incorporating symbols for clarity. Discover the art of timeline creation and improve your communication skills.

Building Timelines
E N D
Presentation Transcript
Building Timelines Show your skills… and communicate effectively!
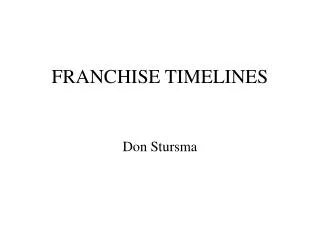
A Timeline of Mrs. Carpenter’s Life Moved to Taipei (2007) Birth to Max (1997) Married David (1991) Lived in Hong Kong (2002-2007) Birth to Sam (1996) Born (1964) 1965 1990 1995 2000 2005
Good Timelines… • Are sequential (years and events are labeled in correct order!) • Are easy to read (neat) because they were PLANNED, drafted, and THEN published! • Represent periods of time in a PROPORTIONALLY accurate way • Make effective use of colorwithout overdoing it • Use blank s p a c e to keep things easy to read: space on borders, space between labels… not… all CRAMMEDtogetherandIMPOSSIBLEtoread!
Good Timeline TIPS: • Label years of events in parentheses example: (1965) • Use a couple colors for a color theme. Use RED only for urgent highlight • Fonts: choose 1 and stick with it. • Do not use “caps lock” or fonts that are all capital letters– hard for the brain to read!
Timeline Symbols Label date of event in parentheses example: (1964)
“Lightning Bolts” show a break in time. Use them to replace a span of many years that you cannot fit onto your page.
Select a couple of colors to establish a nice color theme. Too much color is really BARFY, gets in the WAY of your message, and makes the reader DIZZY! PS: DON’T USE ALL CAPS, EITHER!!!!!
Timeline Symbols Simple Title framed on top
Timeline Symbols “White Space” on borders and between labels must be there!
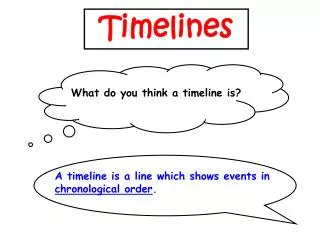
4000 BC 3000 BC 2000BC 1000BC 1AD 1000AD 1500 2000 Hinduism Judaism Buddhism Christianity Islam
Source: Oct 22, 2008. 1301.0 - Year Book Australia, 2005 . Australian Bureau of Statistics. <http://abs.gov.au/Ausstats/abs@.nsf/Previousproducts/6A5AABD7621230ADCA256F7200832F77?opendocument>
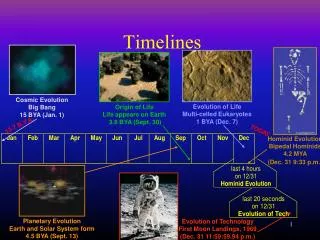
Humans Arrive from Malaysia (40,000 BC) Europeans Discover Australia (Cook in 1770) (500,000- 1 million inhabitants before Europeans) Starting in 1788, some 160,000 convicts were shipped to the Australian colonies. From the early 1790s, free immigrants also began coming to Australia. Gold Discovered in Australia in 1851 (437,655) 50 000 people a year arrive Migration to Australia
Migration to Australia In 1861, men outnumbered women in Australia by more than a third, with about 638,000 men and 462,000 women. By 1901, women made up almost one-half of the population, with 1,977,472 men and 1,796,329 women. = 3,765,000 1 decade later: 1,151,947 World War II (1939=1945) 7 million at end Post-War Immigration Policy “Populate or Perish!” (1945-1965) 1971; 13.5 MILLION Today (2007): 20,979,000
Australia’s History Humans Arrive from Malaysia (40,000 BC) Europeans Discover Australia (Cook in 1770) (500,000- 1 million inhabitants before Europeans) Starting in 1788, some 160 000 convicts were shipped to the Australian colonies. Soon free immigrants also began coming to Australia. Gold Discovered in Australia in 1851 (Population = 437,655.) 50 000 people a year start to arrive! In 1861, men outnumbered women in Australia by more than a third, with about 638,000 men and 462,000 women. By 1901, women made up almost one-half of the population, with 1,977,472 men and 1,796,329 women. = 3,765,000. 1 decade later: 1,151,947 World War II (1939=1945) 7 million at end Post-War Immigration Policy “Populate or Perish!” (1945-1965) 1971; 13.5 MILLION Today (2007): 20,979,000 40,000 BC 1770 AD 1788 1851 1861 1901 1939-1945 1945-19651971 2007
Credits: Mrs. Carpenter, Mr. Parker, and Max Carpenter (fourth grader) of Taipei American School collaborated on this slide show. October 26, 2007 The following pages were accessed for the research presented in this slide show: World Book Online Grolier Online Database Brief Facts about Australia’s population growth: http://members.optusnet.com.au/bnbg6billion/6billionAustralia.htm Australia Population Density Map today: http://www.worldbookonline.com/wb/Media?id=mp000282&st=australia+population Colonial Migrations: http://www.worldbookonline.com/wb/Media?id=lr003917&st=world+population History of Immigration to Australia: http://www.immi.gov.au/media/fact-sheets/04fifty.htm#stats Year by year growth of Australian population (not including Aboriginal Peoples: http://populstat.info/Oceania/australc.htm