Venus Mesosphere Aerosol Characterization from SOIR Measurements
130 likes | 143 Views
This study presents scientific results from the SOIR instrument, including vertical profiles of CO2, CO, H2O, HCl, HF, isotopologues, CO2 rotational temperature, CO rotational temperature, and aerosols. The measurements cover all latitudes and have been conducted since 2006. The retrieval technique used is extinction profiles, which allow for the characterization of aerosols in the Venus mesosphere.

Venus Mesosphere Aerosol Characterization from SOIR Measurements
E N D
Presentation Transcript
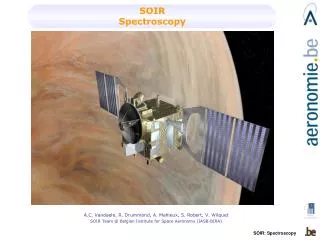
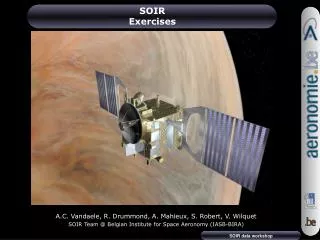
SOIR science status A.C. Vandaele, A. Mahieux, S. Robert, R. Drummond, V. Wilquet, E. Neefs, B. Ristic, S. Berkenbosch, R. Clairquin
Scientific results • From SOIR measurements, construction of a database of vertical profiles of • CO2 density • CO density • H2O density • HCl density • HF density • + isotopologues • CO2 rotational temperature • CO rotational temperature • Aerosols • Measurements occur at terminator • All latitudes covered • Since 06/2006 till now
Factor 5 Factor 10 CO2 density profiles 500 profiles
60K 60K CO2 rotational temperature profiles
CO density profiles 80 profiles
Retrieval technique – Extinction profiles Aerosols The SOIR instrument has the potential of characterizing the aerosols in the mesosphere of Venus. Previous work combining the 3 channels of SPICAV/SOIR showed aerosol layers in successive orbits corresponding to the presence of mode 2 particles of radius up to ~1.0 µm in the upper haze (not observed before). • Transmittances Extinction : • With • taerosol slant opacity • T the transmittance • dzi the thickness of layer i • Ii the atmospheric intensity of layer i • I0 the full sun intensity • βi the extinction of layer i V. Wilquet, et al., J. Geophys. Research, Vol. 114, E00B42, 13 pp., 2009
Extinction profiles retrieved simultaneously@ different wavelength • At high latitude North : extinction profiles are different for each wavelength • Around the equator: the extinction coefficient is less sensitive to the wavelength
Particle size and number density retrievals Method: • Fit of the extinction in function of the wavelength • Refraction index model: spherical particles, 75% H2SO4 • Mie theory to derive extinction cross-section / Log-normal size distribution (rg, sg) • Normalization of the extinction (experimental and model) • Fitting experimental with theoretical values (minimization of merit function)
Spatial coverage of measurements • Data spread over 3 years • Better coverage close to the North pole, due to the geometry of the orbit • Poor coverage between 40 and 60° N, due to orbit • Green crosses: spectra registered @ 3.0 µm
Latitudinal variation of the extinction • Period of 500 days (orbit 884.2 till 1382.1) spread over all latitudes • 82 measurements @ 3.0 µm:40 AM & 42 PM • Polynomial fit (2d order) for each altitude
Aerosols Season 11 Season 13 Season 12 Δ = evening terminator O = morning terminator @ 80 km
CO2 spectroscopy Three bands were rotationally analyzed: n2 + n3 − G.S. (CO2 628) ; 2 n1 + n2 - n2 (CO2628) and 2 n1 - G.S. (CO2638) • ASIMAT: retrieval of atmospheric parameters • New bands linelist, calibrated using HDO lines