Download
1 / 19
190 likes | 378 Views
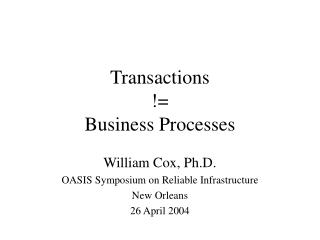
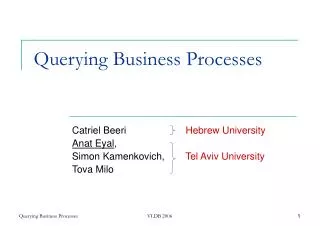
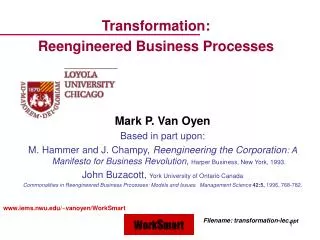
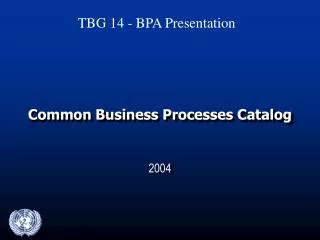
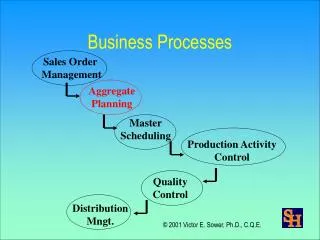
Sales Order Management. Master Scheduling. Production Activity Control. Quality Control. Distribution Mngt. Business Processes. Aggregate Planning. © 2001 Victor E. Sower, Ph.D., C.Q.E. Chapter 13. Capacity And Aggregate Planning . © 2000 by Prentice-Hall Inc

E N D
Sales Order Management Master Scheduling Production Activity Control Quality Control Distribution Mngt. Business Processes Aggregate Planning © 2001 Victor E. Sower, Ph.D., C.Q.E.
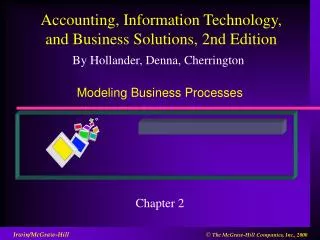
Chapter 13 Capacity And Aggregate Planning © 2000 by Prentice-Hall Inc Russell/Taylor Oper Mgt 3/e
Capacity Planning • Establishes overall level of productive resources • Affects lead time responsiveness, cost & competitiveness • Determines when and how much to increase capacity © 2000 by Prentice-Hall Inc Russell/Taylor Oper Mgt 3/e Ch 11 - 2
Capacity Expansion • Volume & certainty of anticipated demand • Strategic objectives for growth • Costs of expansion & operation • Incremental or one-step expansion © 2000 by Prentice-Hall Inc Russell/Taylor Oper Mgt 3/e Ch 11 - 3
Capacity Expansion Strategies Capacity lead strategy Capacity lag strategy Units Units Capacity Demand Capacity Demand Time Time Average capacity strategy Incremental vs. one-step expansion Units Units Capacity One-step expansion Incremental expansion Demand Demand Time Time © 2000 by Prentice-Hall Inc Russell/Taylor Oper Mgt 3/e Ch 11 - 4
Aggregate Production Planning (APP) • Matches market demand to company resources • Plans production 6 months to 12 months in advance • Expresses demand, resources, and capacity in general terms • Develops a strategy for economically meeting demand • Establishes a company-wide game plan for allocating resources © 2000 by Prentice-Hall Inc Russell/Taylor Oper Mgt 3/e Ch 11 - 6
Inputs and Outputs to Aggregate Production Planning Capacity Constraints Strategic Objectives Company Policies Demand Forecasts Financial Constraints Aggregate Production Planning Size of Workforce Units or dollars subcontracted, backordered, or lost Production per month (in units or $) Inventory Levels © 2000 by Prentice-Hall Inc Russell/Taylor Oper Mgt 3/e Ch 11 - 7
Strategies for Meeting Demand 1. Use inventory to absorb fluctuations in demand (level production) 2. Hire and fire workers to match demand (chase demand) 3. Maintain resources for high demand levels 4. Increase or decrease working hours (over & undertime) 5. Subcontract work to other firms 6. Use part-time workers 7. Provide the service or product at a later time period (backordering) © 2000 by Prentice-Hall Inc Russell/Taylor Oper Mgt 3/e Ch 11 - 8
Strategy Details • Level production - produce at constant rate & use inventory as needed to meet demand • Chase demand - change workforce levels so that production matches demand • Maintaining resources for high demand levels - ensures high levels of customer service • Overtime & undertime - common when demand fluctuations are not extreme © 2000 by Prentice-Hall Inc Russell/Taylor Oper Mgt 3/e Ch 11 - 9
Strategy Details • Subcontracting - useful if supplier meets quality & time requirements • Part-time workers - feasible for unskilled jobs or if labor pool exists • Backordering - only works if customer is willing to wait for product/services © 2000 by Prentice-Hall Inc Russell/Taylor Oper Mgt 3/e Ch 11 - 10
Level Production Demand Production Units Time © 2000 by Prentice-Hall Inc Russell/Taylor Oper Mgt 3/e Ch 11 - 11
Chase Demand Demand Units Production Time © 2000 by Prentice-Hall Inc Russell/Taylor Oper Mgt 3/e Ch 11 - 12
APP Using Pure Strategies Quarter Sales Forecast (lb) Spring 80,000 Summer 50,000 Fall 120,000 Winter 150,000 Hiring cost = $100 per worker Firing cost = $500 per worker Inventory carrying cost = $0.50 pound per quarter Production per employee = 1,000 pounds per quarter Beginning work force = 100 workers © 2000 by Prentice-Hall Inc Russell/Taylor Oper Mgt 3/e Ch 11 - 13
Level Production Strategy Sales Production Quarter Forecast Plan Inventory Spring 80,000 100,000 20,000 Summer 50,000 100,000 70,000 Fall 120,000 100,000 50,000 Winter 150,000 100,000 0 400,000 140,000 Cost = 140,000 pounds x 0.50 per pound = $70,000 © 2000 by Prentice-Hall Inc Russell/Taylor Oper Mgt 3/e Ch 11 - 14
Chase Demand Strategy Sales Production Workers Workers Workers Quarter Forecast Plan Needed Hired Fired Spring 80,000 80,000 80 - 20 Summer 50,000 50,000 50 - 30 Fall 120,000 120,000 120 70 - Winter 150,000 150,000 150 30 - 100 50 Cost = (100 workers hired x $100) + (50 workers fired x $500) = $10,000 + 25,000 = $35,000 © 2000 by Prentice-Hall Inc Russell/Taylor Oper Mgt 3/e Ch 11 - 15
Strategies for Managing Demand • Shift demand into other periods • incentives, sales promotions, advertising campaigns • Offer product or services with countercyclical demand patterns • create demand for idle resources © 2000 by Prentice-Hall Inc Russell/Taylor Oper Mgt 3/e Ch 11 - 21
Demand Distortion along the Supply Chain The bullwhip effect © 2000 by Prentice-Hall Inc Russell/Taylor Oper Mgt 3/e Ch 11 - 22
Hierarchical Planning Process Items Production Planning Capacity Planning Resource level Product lines or families Aggregate Resource Plants Production Plan Requirements Plan Individual products Critical work centers Master Production Rough-Cut Schedule Capacity Plan All work centers Material Capacity Components Requirements Plan Requirements Plan Manufacturing operations Individual machines Shop Floor Input/Output Schedule Control © 2000 by Prentice-Hall Inc Russell/Taylor Oper Mgt 3/e Ch 11 - 23
Aggregate Planning for Services 1. Most services can’t be inventoried 2. Demand for services is difficult to predict 3. Capacity is also difficult to predict 4. Service capacity must be provided at the appropriate place and time 5. Labor is usually the most constraining resource for services © 2000 by Prentice-Hall Inc Russell/Taylor Oper Mgt 3/e Ch 11 - 24